Calflora
Weed Manager:
Resources, Applications and Techniques
Updated
March 25, 2022
Weed Manager (WM) is a system used by agencies and organizations across California
to map, track treatment and change over time, and create customized reports on invasive plant infestations.
Please see below for subscription costs and details about how the WM system works. For more information, please
contact Calflora.
A discussion of core components of Calflora's Weed Manager system, news, new versions to be tested, planning,
funding, etc.
If you are not yet a member, press Apply to join group
An app for collecting data about wild plants,
using group-specific data collection forms.
The Android version is available on
Google Play.
The iOS version is available on
iTunes.
Using this application, you can view, enter or edit a
plant observation record.
The same projects and forms
are available in both the Observer Pro phone app and POE.
If you are a member of a Weed Manager group,
then you have access to projects and forms
specific to that group.
When you use POE to edit a record made with
Observer Pro, it will come up with the same
project and form used to enter it.
However, you can also change the project and form of a record
from within POE.
For instance, suppose a record was originally entered with
the Simple Data Collection form.
Using POE, you could change it to a project that
has the Advanced Data Collection form, and
then fill in the weed related fields that are not present in
Simple Data Collection.
You can also use POE to enter new records.
When entering a new record, choose your group from the
drop down, and then choose one of your group's projects.
As soon as you have chosen a project, the page below will be filled
with the data collection form that goes with that project.
The Group Observations application
makes all records owned by an group
available to all members of that group.
The results include both published and
unpublished records.
The results can viewed through one of several column sets,
such as Basic Data or Weed Data Export.
As a member of a Weed Manager group,
there are additional column sets are available,
one for each of the data collection forms that your group uses.
By choosing a column set that corresponds to one
of your group's data collection forms,
you can download all of the data you collected
(including any special fields such as those related to treatment).
The results can be downloaded in several flat file
formats, as CSV, JSON or GeoJSON, or as a shapefile.
This application is similar to Group Observations,
except that you can search for records from
multiple groups at the same time.
This can be useful if you are a member of more than one
Weed Manager group.
It has a spreadsheet like editing interface.
If you are the owner of a group (or have the Data Czar role
within a group), use this application to view and edit existing projects,
or to add new projects.
When you are adding a new project, enter a name and a
description, and choose a data collection form.
This app will preview the various data collection forms which are available.
You can optionally also choose a starting location and a plant list.
If you are a member of a group, use this application to view
the various projects defined for that group.
With this application, you can
view and edit any of the lines and polygons you have drawn
or uploaded to Calflora.
You can also draw a new line or polygon,
upload a shapefile with polygons or lines in it,
or upload a KML tracklog.
Each shape record optionally has a name.
If you give a polygon record a name, you can use it in searches;
eg. from within Observation Search or Group Observations.
Each shape record also has a declared purpose.
The presumed purpose for any polygon with a name is search.
The presumed purpose for any line or polygon entered as
part of entering a plant observation without treatment information
is assessment.
The presumed purpose for any line or polygon entered as
part of entering a plant observation with treatment information
is treatment.
Use this application to choose which lines and polygons will appear in the Observer Pro phone application.
Selection is on the basis of group -- for each group you are a member of, you can have a different set of lines and polygons.
See also this Observer Pro TIP.
A survey is a focused search for
certain plants, in a discrete area, and over a limited amount of time.
Using this application, you can view, enter, or edit a survey record.
Enter what crew did which activity, on what day, for which project.
Note that when you are viewing a Weed Manager observation/treatment record in POE,
you can directly view and edit all Work Session records associated with that observation.
If you need a custom plant list (eg. for one of your group's
projects), use this application to define it.
When using the Observer Pro phone application,
having a short plant list can sometimes make data entry go much faster.
Techniques
MEMBER ROLES
If you are the owner of a Weed Manager group, you have ultimate administrative
control over that group, in the sense that you can add members,
remove members, and assign roles to members. Below is a description of
the currently available roles.
owner
The owner can add and remove members, and assign roles to members.
data czar
A data czar can
edit any observation record in the group.
project czar
A project czar can edit any observation record in the projects to which they have been assigned.
team leader
A team leader has a few editing privileges that a regular member does not have; see below.
regular member
A regular member can add records and edit their own records with
Plant Observation Entry.
A regular member can view all group records with
Group Observations.
nominal member
A nominal member is able to add records to the group,
into any of the projects defined for that group.
A nominal member cannot use any of the supporting applications.
With respect to the supporting applications,
a member's role determines what he or she is able to do.
Group Options:
A regular member can use this application to view data
if the policy to limit access for regular members is not in effect.
A team leader and a data czar can use this application to edit data.
Project Setup:
A regular member can view projects. A team leader
can edit an existing project, but not make a new project.
A project czar can edit any project to which they have been assigned.
A data czar can edit an existing project and make a new project.
Work Session Entry:
A regular member can view records.
A data czar, project czar or team leader can edit records.
Plant Observation Entry:
A nominal member can view
observation records
added by other members of the group,
but only in the same way that a non-group member would see them:
that is, without any form specific details (without treatment information).
REGIONS
If your group
is responsible for certain regions, and
has desktop GIS files with the boundaries of those regions,
Once uploaded, the region polygons
will become part of your group's portfolio of shapes.
There are two immediate benefits:
The region polygons become available for searching
purposes (to all members of the group) from
applications such as Group Observations, Observation Search,
and What Grows Here?
When a member of your group enters a new record,
and coordinates of the record fall within the boundaries of
one of the regions, the Region field of the record will
be assigned the name of the region.
This applies to records coming in from the phone or from the web.
How to do it:
Make sure your regions are available as a shapefile, including
the projection (.prj) file component.
From the
Shape Editor application,
open
Upload.
In Step 1, you will upload the shapefile from your computer to a
temporary table on the server.
In Step 2, choose which attribute from the shapefile
contains the name of the region.
Set the value of group to your group.
Set the value of purpose to REGION.
Then press
.
The next time you do a search from the Shape Editor,
you should see them.
Using the Polygons
To use one of the region polygons as a search area in
Group Observations,
open
POLYGON,
then open
SAVED SEARCH POLYGONS,
and choose the region by name from the drop down list.
Region polygons can also be loaded into the phone app.
Each group member can use the
Background Lines and Polygons application to choose which polygons
they want to see on their phone.
A project is an organizational device for isolating
observation and treatment records so that they can be
easily searched for and reported on.
In Weed Manager,
work session data is associated with observation and treatment data
by project and date.
Once a project has been defined, and records have
been added to it,
it is possible to correspond work session information
with observation and treatment information.
In other words, when you see some observation and treatment
records for a certain project on a certain day, you will be
able to to tell how many hours your group spent doing that work.
SAVED SEARCHES
Saved searches are an effective way to limit what
records you will see in Observer Pro for a particular project.
They are also a useful way to share a set of interesting records
with other people, either inside or outside of your group.
Searches can be saved directly from
Group Observations:
1. do the search;
2. open TOOLS
and SAVED SEARCHES;
3. enter a name for the current search; and
4. press .
A search saved in this way will be immediately accessible to
anyone in your group, and will not be accessible to anyone
outside of your group.
If you are planning to use the search to load historical records into Observer Pro,
it is recommended to set the History Filter to only the most recent.
This will ensure that only a single record will be displayed for each population
(history stack).
Searches can be saved directly from
Observation Search
or
My Observations:
1. do the search;
2. open TOOLS
and SAVED SEARCHES;
3. enter a name for the current search; and
4. press .
You can find all of your saved searches in
My Calflora / Searches.
To edit or delete a search record, click on
just to the left of the record.
If you want an Observation Search search to be available to one of your groups,
choose a group from the drop down.
In a Group Observations search, all records
typically come from the same group. However, in an Observation Search search,
you can include published records from various sources.
So, if you need to see records from other sources while you are using Observer Pro --
for instance, observations of weeds from casual observers --
then a search using Observation Search is the way to go.
Using a Saved Search for Historical Records in Observer Pro
Once you have saved a search, you can use it to control which
historical records appear for a particular project in Observer Pro.
To do so, go to
Project Setup, choose your group, choose the project,
and press .
Any searches that have been saved associated with the group
(by you or by anyone else in the group) will appear in the
HISTORICAL RECORDS (saved searches) drop down. Choose the
relevant search, and then save the project record.
More details are available in
Project Setup Help.
POPULATION RECORDS
When a history stack has polygons. a population record is automatically created for it.
The population record is linked to the stack by means of root record ID.
The population record has attributes that apply to all observation records in the stack.
One of the polygons that belongs to a record in the stack becomes
the reference polygon for the stack.
Typically, the reference polygon is the polygon from the oldest record in the stack.
It may also be the largest polygon of any record in the stack.
The reference polygon is used to represent the stack in graphical situations
where many records with polygons are displayed at the same time; for instance,
in the Nearby function of POE, or in the Plant Distribution application.
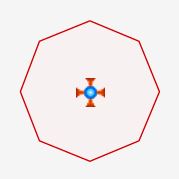
You can change the reference polygon in POE when you are editing any one of the records in the stack.
Press POPULATION
(bottom left) to open the population record editor.
The REFERENCE POLYGON drop down has the identifier of each polygon used
by a record in this stack. To see the current reference polygon as a blue outline,
check Show the reference polygon on the map.
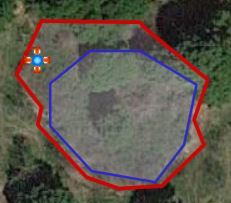
When the polygon of the current record is showing in red, and the
reference polygon is showing in blue, you can easily see the difference.
A population record also has these other optional attibutes, which describe all observations in the stack:
Access to the Site
(how easy is it to get to the population, on a scale from 1 to 10),
Priority (how important is it, on a scale from 1 to 5), and
Plant Count (a summary of plant counts from the previous calendar year).
A patch that has grown larger since the original record:
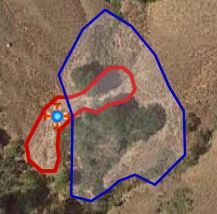
A patch that has shifted since the original record:
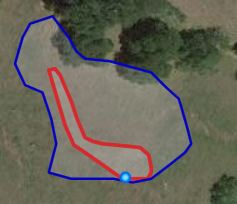
A patch that has been reduced by treatment since the original record:
COORDINATION BETWEEN APPLICATIONS
(Running more than One Application at the Same Time)
The Weed Manager system includes about twenty web applications.
These applications coordinate with each other through the database
on the server. However, if you make a change in application #1
that affects application #2,
and you are already running application #2, the change will not
be automatically communicated to the running version of application #2.
You will have to reload application #2 to see the change.
For instance, suppose you have the Group Observations application open,
you have chosen a plant list call "Early Fall Blooming Herbs",
and you are looking for the plants on that list in a certain area.
Then you open the Plant List application, add a new plant to
the "Early Fall Blooming Herbs" list, and save the list.
At this point, the database has the lastest version of the list.
But, back in the your running version of Group Observations,
it is still using the old version of the list.
To get the latest version of the list,
you must reload Group Observations. To do so, simply press the browser refresh button.
EXPORTING DATA
You can download the records you have been collecting in Weed Manager
from the
Group Observations application.
Do a search, then open
TOOLS / DOWNLOAD RESULTS.
When you download a shapefile, the attribute names are deliberately shortened
in accordance with this
data dictionary.
Some forms have a Radius field. If you collect a point and a radius,
the system will display the record on maps as a circle around a point,
and automatically calculate Gross Area as π R2.
If you have a record with a point and a radius,
you can use POE to generate a regular polygon around the point
based on the radius. The generated polygon will have between 8 and 20 vertices
depending on the value of radius.
Because Weed Manager uses the Google Maps API, it is necessary to display
a polygon on a Google Map to calculate the area.
This can be done in either POE
(record by record)
or Group Observations
(many records at once).
So, here are two ways or recording approximately the same information:
a point with a radius
a point with a regular polygon.
The first way is more economical in terms of system resources, and has
the advantage that Gross Area can be calculated without displaying the figure on a map.
The second way is useful for these reasons:
You are planning to eventually edit and customize the polygon. The generated polygon is a good starting point.
You will be exporting data to an external system, and you want every exported record to have a polygon.
A point with a 3 meter radius.
Area: 28.3 square meters.
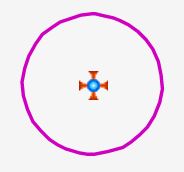
A regular polygon (octagon)
generated from a point with a 3 meter radius.
Area: 25.4 square meters.
Observer Pro Techniques
LOADING HISTORICAL OBSERVATIONS ONTO OBSERVER PRO
Some Weed Manager users have encountered
capacity problems when they loaded large numbers of historical observations onto Observer Pro.
Here are some techniques to control how many historical observations are loaded onto Observer Pro
when you do a REFRESH.
If you are able to edit projects, then for each project, use
a saved search to determine which historical observations are loaded
for that project. If you do not assign a saved search, then all observations
in that project will be loaded. With a saved search, you can limit
the historical observations available in Observer Pro to just those
that you are going to need in the field.
Go to
My Calflora / Preferences / Using Observer Pro with Groups.
If you are a member of multiple groups, you can choose
one or more of them as active --
during your next session with Observer Pro,
you will able to contribute data to any group selected as active.
Inactive groups will not appear on the phone at all.
For each active group, you can choose one or more projects.
During the next REFRESH, historical observations will only be loaded
into Observer Pro for the selected projects.
Practically, using this feature to control what project data
is loaded onto the phone can make a huge difference in the time
it takes to do a REFRESH. Also, when less historical data is loaded,
Observer Pro responds more quickly, and you may able to find
the plant populations you are looking for more easily.
Note that choosing active groups and projects is a personal preference.
If another member of your group needs to work on different
projects from you on the same day, they can set it up with their own preferences.
USING BACKGROUND LINES AND POLYGONS
Observer Pro has the ability to show
background lines and polygons which are not connected to any observation.
When using Observer Pro in the field, a background line or polygon might help you find a trail or a survey area, particularly if the area is not marked by fences or other physical signs.
Compared with offline maps, they are relatively easy to make -- you can draw your own in the Shape Editor, or upload a shape from desktop GIS.
Which lines and polygons to display is a personal choice.
Use the
Background Lines and Polygons
application to choose the ones you want.
When you select your group from the drop down, it will
load a table with all of the named lines and polygons associated with
that group.
To select a shape to be uploaded to Observer Pro, click on the purple pencil,
and then check Available in Observer Pro?.
Then choose a color, and press .
The next time you do a REFRESH from Observer Pro, your selected shapes
will be uploaded. They will appear on the map whenever you make an
observation for that group, or look at the History map for that group.
The choice of background polygons is per user and per group. If there
are several members of the group in the field on the same day, they each might choose
different background lines and polygons. You can load as many shapes
as you want onto the phone. However, if you upload a lot of complicated shapes
(each with many vertices), it could potentially slow down the performance of Observer Pro.
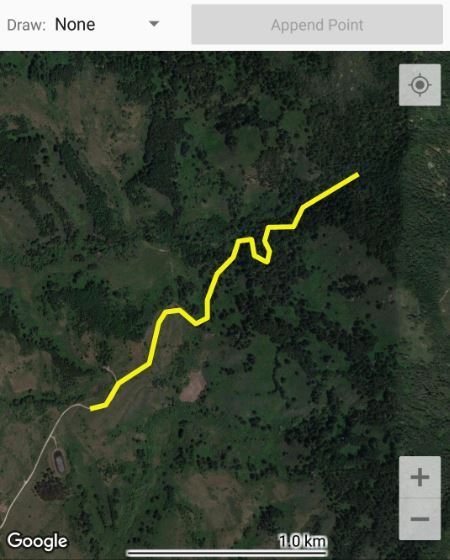
On the phone, each background shape is drawn as a colored line.
With the "Map" background selected, yellow can be difficult to see, but with
"Satellite" selected, it really stands out (see the screenshot on the right).
The background shapes are not labelled when they appear on the Observer Pro map,
so it is a good idea to be familiar
with your chosen shapes before you are out in the field.
If you are loading many lines and polygons onto the phone,
it may also be a good idea to differentiate them by color -- for instance,
by making REGION polygons cyan, and TRAIL lines yellow.
Observer Pro (Android) can load and display offline maps.
These can be useful if you are doing field work somewhere with very poor connectivity,
and unable to get Google Maps.
There arre a few offline maps now available to all users.
It is also possible to make your own private offline map, and load it into the phone app.
See this document
MapTiler Workflow
for instructions on creating offline map caches with MapTiler and ArcGIS, and on creating offline map caches from GeoPDFs.
Weed Manager is a powerful and flexible system; each agency or organization chooses how to use it.
Set up your Weed Manager Group
Set up your own group using the
Manage Groups application; you may always add and change your group members and levels of access later.
Once you have set up a group and paid your Weed Manager subscription, Calflora staff will elevate it into a Weed Manager group.
Also using Manage Groups, you can add members to your group
by email address. Each group member must be registered with Calflora as a data contributor, which can be performed in the upper right corner of most Calflora pages.
HOURS
If you are tracking work hours with WM, your WM data collection forms need to contain hours fields.
When an observation (treatment) record is uploaded from the phone to the server, the hours values are
transferred to the Work Session (WS) table. All hours reporting is done on the basis of
what is in the WS table. The advantage of this approach is that there can be
more than one WS record for a single observation record. So for instance, if two or more crews worked on
the same treatment, you can track their hours separately.
Here is how two different groups have set up hours fields on their forms:
Group 1
The field form has slots for three different crews. Each is a drop down where the user can
choose from the possible crews. For each crew, there is an field for total person hours.
At upload, if all three crew fields have a value, then three WS records will be generated.
Group 2
The field form has slots for Staff Hours, Contractor Hours, and Volunteer hours.
At upload, if all three fields have a value, then three WS records will be generated.
POINT and POLYGON
All observation records made on the Observer Pro phone app will have a point.
A record might also have a line or a polygon. A polygon might be the result of the
user walking the perimeter of the plant population and appending points, or it might
be drawn freehand.
Some WM groups require a polygon on every observation made in the field.
This requirement can slow down data collection, but it does ensure the uniformity of the collected dataset --
every record will have a polygon, and therefore an area.
There is another approach that is almost as good as drawing a polygon on every record,
but much faster:
the user puts the point in the center of the plant population, and then specifies a radius in meters,
suggesting a circle that encompasses the whole population.
WM groups that use this approach make the radius a required field on their forms.
From a point and a radius, the system can generate a regular polygon (for instance, an octagon).
This generation can happen automatically when the record is uploaded from the phone app to the server,
or manually when editing the record in Plant Observations Entry.
When this is done consistently, it also ensures the uniformity of the collected dataset --
every record will have a polygon, and therefore an area.
From a line and an radius (AKA buffer), the system can generate a polygon.
This can happen automatically or manually in Plant Observation Entry.
More than one form: Some groups use a lightweight form (no polygon required) for
EDRR work, and another longer form for serious weed treatment.
TREATMENT INFORMATION
Treatment Method is the field the system uses to determine if a observation record
concerns treatment, or not. If Treatment Method has a value, then the record
is assumed to concern treatment; otherwise the record is a plain assessment.
Here is how two different groups have set it up:
Group 1
On the form, Treatment Method is a choice between "none", "Herbicide", and various manual methods
such as "Hand Cut".
When the user chooses "Herbicide", the chemical specification fields open up.
Group 2 Treatment Method is a choice between "none", "Manual", and "Chemical".
When the user chooses "Manual", a Manual Method drop down opens up.
When the user chooses "Chemical", a Chemical Method drop down opens up,
and the chemical specification fields open up.
SPECIFYING CHEMICALS
Here is how two different groups specify a mix of chamicals on their form.
The assumption in both cases is that chemical products (herbicides, surfactants, and dyes)
will be mixed together in the same solution.
Group 1
There are fields to record the total solution amount and units (for instance, 3 gallons).
There are drop downs for three chemical products.
For each chemical product, there is another field where the user enters the percent of the
total solution made up by that chemical product.
Group 2
There are drop downs for two chemical products. For each chemical product, there is another field
where the user enters how many ounces were used of that chemical product. There is no field
recording the total solution amount.
In a situation where your crew mixed up 3 gallons of some chemical combination and then used it
to treat 20 plant polulations during the same day, it could become tedious to entry the same chemical
mix for each of 20 treament records. A time saving way to handle this situation is to use the
Hour / Herbicide Distributor
application to apportion those 3 gallons across those 20 treatment records after the fact.
SPECIAL PERMISSIONS FOR CERTAIN GROUP MEMBERS
The owner of a WM group can add and delete members, and assign special permissions to certain members.
A member with Data Czar permission can edit any observation record belonging to the group,
and can also change any Work Session record.
Data Czars are in charge of quality control. For a group with many members and a lot of new records coming in every day,
it may be advantageous to appoint several members as Data Czars.
A member with Project Czar permission can be assigned to one or more projects,
and can edit any observation record associated with their assigned projects.
PROJECTS
You can add as many projects as you need. Each project will appear in the
phone app for group members, and may have a set of historical records associated with it.
When a user chooses a project on the phone, that project's
historical records show up on the History map.
By following this map, the user will be able to find them on the ground.
WM groups typically define projects based on some combination of these factors:
plant or plant list
management unit(s)
For instance, some groups have prepared a list of EDRR plants that they might find
in any management unit. Then they make an EDRR project to contain sightings and treatment of these plants
across all management units.
Limiting the number of historical records that a user sees on the phone in the field is
an important consideration. You can control this by using the
Project Setup application
to assign a saved search to a project.
There might be 2,000 records in a project. Since this is too many
for the field crew to deal with, you could use a saved search to isolate 100 of these records --
the populations that you want them to find and re-assess or treat.
If you change your mind about how projects should be organized, records can easily be
moved from one project to another with
Group Observations / Batch Edit.
Calflora is an equal opportunity provider and employer.
In accordance with Federal law and US Department of Agriculture policy,
Calflora is prohibited from discriminating on the basis of race, color,
national origin, sex, age, or disability. (Not all prohibited bases apply to all programs.)
To file a complaint of discrimination, write USDA, Director,
Office of Civil Rights, Room 326-W, Whitten Building, 1400 Independence Avenue,
SW, Washington, DC 20250-9419 or call (202) 720-5964 (voice and TDD).
USDA is an equal opportunity provider and employer.
The following organizations have provided
the principal funding for the development of the
Weed Manager system:
USDA Forest Service
Marin County Parks
National Park Service
(San Francisco Bay Area Network of National Parks)
Midpennisula Regional Open Space
Tamalpais Lands Collaborative
(ONE TAM)
The following organizations have provided funding for
Weed Manager components as well as technical and design assistance:
 Upload
 just to the left of the record.
If you want an Observation Search search to be available to one of your groups,
choose a group from the drop down.
just to the left of the record.
If you want an Observation Search search to be available to one of your groups,
choose a group from the drop down.