| ||||||||||||||||||||||||||||||||||||||||||
|
Updated December 6, 2022
The
Group Observations application
lets you search for plant observations
associated with any group of which you are a member,
and see them on a map.
This application is similar to Observation Search (see Observation Search Help for details), but has some additional features which are useful for managing the records of a single group. For instance, Group Observations will show unpublished records associated with a group, where Observation Search will only show published records.
If you have any questions about this application, please contact |
||||||||||||||||||||||||||||||||||||||||||
| Search Criteria | ||||||||||||||||||||||||||||||||||||||||||
|
Start Date and End Date are inclusive.
Dates are entered in the format YYYY-MM-DD
so that February 20, 2019 is written as 2019-2-20.
If you enter
2019-2-20 as the end date, the result will include
records that were entered on or before 2019-2-20.
If you put the same date in both
Start Date and End Date,
the results will only include records entered on that date.
Other search criteria in this application are largely similar to
 More Criteria More Criteria
|
||||||||||||||||||||||||||||||||||||||||||
| Results | ||||||||||||||||||||||||||||||||||||||||||
|
The results appear simultaneously as points
on the map and in a table below the map.
This application will display both published
and unpublished records.
If you click on a point | ||||||||||||||||||||||||||||||||||||||||||
|
detail;
Open the detail page for this record, including all photos and any comments
that may have been made by other users on this record.
editor; Open Plant Observation Entry on this record.
|
||||||||||||||||||||||||||||||||||||||||||
|
The results can viewed through one of several
column sets, such as Basic Data
and Weed Data Export.
You can also make up a custom column set:
open
customize, If you are part of a Weed Manager group, additional column sets are available, one for each of the data collection forms that your group uses.
Population Records
customize |
||||||||||||||||||||||||||||||||||||||||||
| Custom Column Sets | ||||||||||||||||||||||||||||||||||||||||||
|
Open
customize If you would like your chosen set of columns to appear by default whenever you use this application, check |
||||||||||||||||||||||||||||||||||||||||||
| Saved Column Sets | ||||||||||||||||||||||||||||||||||||||||||
|
Once you have used
customizeTOOLS
To bring back a previously saved column set, open
| ||||||||||||||||||||||||||||||||||||||||||
| Symbology | ||||||||||||||||||||||||||||||||||||||||||
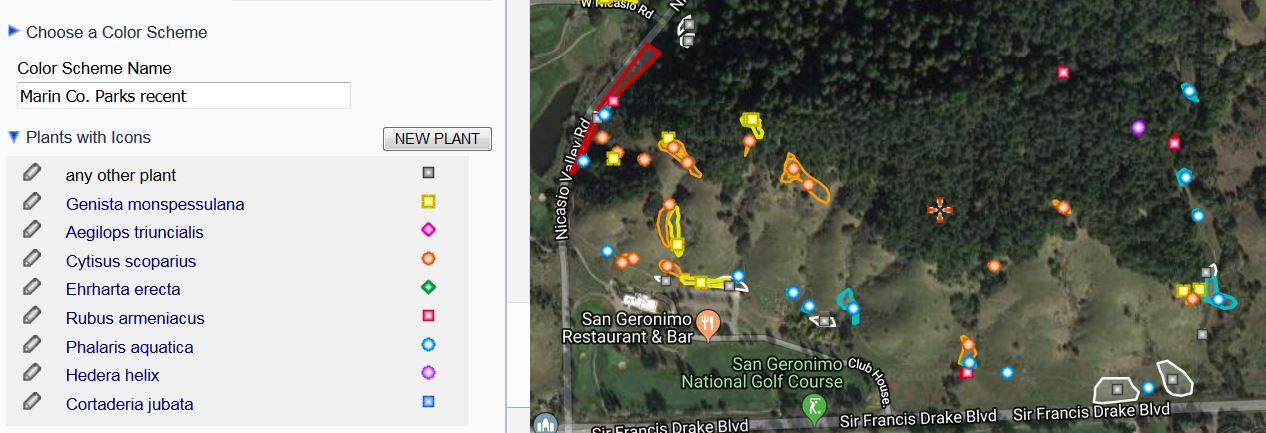
Use the Symbology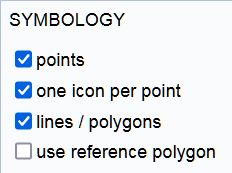
If you check
If you also check
If a polygon is available for a particular
observation, it will be displayed in a color that matches the icon.
When you click on the colored icon, the polygon boundary is draw with a thicker line,
indicating it is selected.
Once this theme is selected,
open
Plants with Icons to represent Rubus armeniacus.
Here is an example showing eight weeds recently mapped by Marin County Parks in the Roy's Redwoods Open Space Preserve:
Once you have assigned colored icons to particular plants, you can save your choices as color scheme, and use it again later. Color schemes are associated with a group -- any color scheme you save will be available to other members of the group. The Management Status Theme
You can view observations acording to their management status using
the following icons:
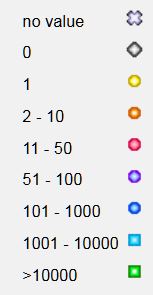
The Plant Count Theme
Note that "reported" (the yellow point) indicates records for which the value of Management Status is empty.
You can view observations acording to the value of Number of Plants
using the following icons:
The Population Plant Count Theme
This value is typically calculated based on a summary of the
previous year's plant count values for all observations of this population. You can view it and change it in POE.
The Population Priority Theme
To use this theme, you need to add a population priority value to each population record
using POE.
The Stack Theme
To use this theme, you need to be using the Stack View column set.
 represents represents
| ||||||||||||||||||||||||||||||||||||||||||
| Download | ||||||||||||||||||||||||||||||||||||||||||
|
To download the result data onto your local computer,
open
TOOLS
Shapefile Formats
When you download, the downloaded results will include the same fields that are displayed in the current column set.
customizeIf you want to include the reference polygon from the associated population record, add Reference Polygon to your column set. Note that when Reference Polygon is included in the column set, and a particular record does not have a population record, but does have its own polygon, that polygon will be included in the results. To get data into Excel, choose the CSV-Excel format. There is some extra formatting that happens with this format to ensure that the data appears properly in Excel. The Number of Plants field might have a range value such as 51 - 100. Excel will try to interpret this value as a date. If you choose the CSV-Excel format, it will prevent this from happening. | ||||||||||||||||||||||||||||||||||||||||||
| Saved Searches | ||||||||||||||||||||||||||||||||||||||||||
|
You can save a Group Observations search and run it again later.
To save the current search, open
TOOLS
To see all of your saved searches
go to
MyCalflora / Searches.
For Weed Manager groups, to see all searches associated with your group,
go to
To set up an email alert from a saved search, go to MyCalflora / Alerts. | ||||||||||||||||||||||||||||||||||||||||||
| Batch Editor | ||||||||||||||||||||||||||||||||||||||||||
|
The Batch Editor
is a feature of this application
which can make changes to many of your group's records at the same time.
It is a powerful and potentially dangerous tool,
in that changes are not easily recoverable.
To open the editor, enter some search criteria,
and press . In the editor panel, you can specify changes to the records that match your search. Once you have entered the changes you want to make, press . This action will ask you to confirm, and then apply the changes to all of the records that match your search, even if you cannot see them in the result table.
For instance, to publish all matching records,
set
To cause a particular field to be empty (have no text in it), enter null.
Convert Lines to Polygons
Calculate Infested Area
Calculate Percent Cover
Calculate Gross Area from Radius
Priority Ranking
| ||||||||||||||||||||||||||||||||||||||||||
| Recalculate Gross Area | ||||||||||||||||||||||||||||||||||||||||||
|
Gross Area is typically calculated when a record
with a polygon is first uploaded into the database.
It may also be calculated explicitly (for instance, after editing the polygon)
in Plant Observation Entry.
This command will recalculate the size of the polygon for
all matching records.
To run this command, enter some search criteria, and press . Then open TOOLSBecause it relies on the area function in the Google Maps API, this command is interactive. For each matching record, you will see the polygon on the map, and see the calculated gross area in square meters. Press to proceed to the next matching record. If the command is unable to calculate the gross area of a polygon for some reason, you will see an error message.
After the command has finished, search again for the same records to
see the newly calculated value of Gross Area.
| ||||||||||||||||||||||||||||||||||||||||||
| More Information | ||||||||||||||||||||||||||||||||||||||||||
|
For more information about background layers, see
Layer Help.
For more about data collection forms and other fields, see Plant Observation Entry Help
For a step-by-step explanation of the process of drawing your own search polygon, see
| ||||||||||||||||||||||||||||||||||||||||||
| Release notes | ||||||||||||||||||||||||||||||||||||||||||
|
• January, 2021: v. 2.82:
An Hours field is available which shows the sum of all Work Session records associated with this observation.
• September, 2020: v. 2.78:
• July, 2020: v. 2.70:
• May, 2020: v. 2.58:
• August, 2019: v. 2.46: A new function, Convert Lines to Polygons, is available in the Batch Editor. • July, 2019: v. 2.42: The symbology themes Population Plant Count and Population Priority are now available to all groups. • April, 2019: v. 2.37: When you are using symbology, and you select a record by clicking on a colored icon on the map, an InfoWindow pops up from the point, and the boundary of the associated polygon is drawn with a thicker line. As of this version, the boundary stays in this thick state after you dismiss the InfoWindow. • December, 2018: v. 2.35: Symbology now has four themes. Management Status in Batch Edit now has the value "reported", indicating an empty value for Management Status. • August, 2018: v. 2.16: Minimum priority ranking added to More Criteria. Priority Ranking added to the Batch Editor. • July, 2018: v. 2.15: All columns are sortable. • June, 2018: v. 2.10: Symbology. Polygons of matching records can be displayed on the map. • October, 2017: v. 1.85: In the results table, when you scroll down so that the column names are no longer visible, a pane opens at the top of the page showing the column names. With the Geometry search criterion, you can search for records with a line, or records with a point and a radius.
• September, 2017: v. 1.76:
Two new features:
• January, 2017: v. 1.65:
Three new columns are available:
• September, 2016: v. 1.60: Column sets can be saved by name. • March, 2015: v. 1.29: The History Filter selection criterion is available, capable of returning only the most recent record when there is more than one record of a single patch.
• January, 2015: v. 1.19:
Searches can be saved by name. Open
• December, 2014: v. 1.18:
It is now possible to select more than one project in a single search.
Open • December, 2014: v. 1.16: New selection criteria: Access by others (published, unpublished or private) and Treatment. The Basic Data column set now includes Access, to make it easy to distinguish published from unpublished records. • August, 2014: Group Observations v. 1.06 (beta) released. | ||||||||||||||||||||||||||||||||||||||||||
 to view this stack in Plant Observation Entry.
 on the map,
an InfoWindow opens at the point,
the table scrolls down to
the corresponding record,
and the record ID is highlighted.
If you click on a record ID in the table,
an InfoWindow opens at
the corresponding map point,
and a short menu opens up under the record ID.
on the map,
an InfoWindow opens at the point,
the table scrolls down to
the corresponding record,
and the record ID is highlighted.
If you click on a record ID in the table,
an InfoWindow opens at
the corresponding map point,
and a short menu opens up under the record ID.