| ||||||
|
Updated October 30, 2023
With the Plant Observation Entry application (POE) you can view, enter or edit a plant observation record. Every record has a point location. A record might also have
|
|
|||||
| Adding a New Record | ||||||||||||
|
1. Press
2. Choose a Group (AKA "Organization"). The choice of group determines which projects are available. If you choose the Independent group, two projects are available: Simple data collection and Advanced data collection. If you are part of a Weed Manager group, other projects will be available.
3. Choose a
Project.
Choice of project determines which dynamic form appears in
4.
Press
 . .
For a step-by-step explanation of the process, see B. Alternatively, if you have exact coordinates from another source, press 
5. Choose a plant by typing a few characters into either
Scientific Name
or Common Name,
and selecting a plant from the drop down.
|
||||||||||||
|
6. To add a shape, press
|
|
|||||||||||
|
7. To add a photo, press
|
|
|||||||||||
|
8. Fill in values for any of the other fields in Section 5. If you drew a polygon, press calculate next to Gross Area. 9. Press SAVE. Required values are indicated by *. If any required field values are missing, the application will let you know. |
||||||||||||
| Adding a New Record from a Geotagged Photo | ||||||||||||
|
1. Press
2. Choose a Group, for instance, Independent. 3. Choose a Project, for instance, Simple Data Collection.
4. Press
5. Enter the name of the plant (or if you are not sure, enter "unknown"). Fill in values for any of the other fields. 6. Press SAVE. |
||||||||||||
| Adding a New Assessment of a Previous Record / Making a History Stack | ||||||||||||
|
|
NOTE: If the existing record has a polygon, you can use exactly the same
polygon in the new assessment, or start with a copy of the existing
polygon and modify it for the new assessment, or start from scratch and
draw a new polygon.
Check use the current shape again
Check copy the current shape
|
|||||||||||

| Viewing a Record (how the page is organized) | ||||||||||||||||||
|
The right side of the page is devoted to a map.
The left hand side is scrollable, and organized into four sections.
Header:
The record header shows
what the application is doing at the moment
(viewing an existing record, editing an existing record, or
adding a new record).
|
|
|||||||||||||||||
Section 1:
Record ownership and control
|
| |||||||||||||||||
|
At the bottom of Section 1 are control buttons.
If you are viewing your own record, press the EDIT
button in order to make changes.
Press the NEW RECORD button to add a new record.
|
| |||||||||||||||||
|
Section 2:
Shape
and Point Location
If a shape (polygon or line) is defined for this record,
a red oval
 .
You can move the map cursor without changing the
location of the record. .
You can move the map cursor without changing the
location of the record.
Generating a Polygon. If the form you are using has a Radius field (also called Buffer), then it is possible to generate a polygon from either a point location or a line. After generating a polygon, the Gross Area will be automatically calculated.
To generate a polygon, start editing the record and open
Shape
.
POINT: If the record has a point location but no line, then the value of Buffer is understood as the meter radius of a circle around the point. The generated regular polygon will have between 8 and 20 vertices depending on the value of Buffer. Here is an octagon generated around the point with Buffer at 3 meters: 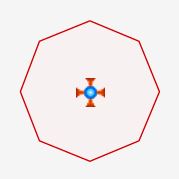
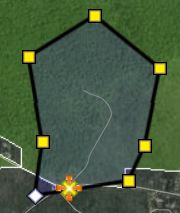
LINE: If the record has a line, then the value of Buffer is understood as the area on either side of the line to be inluded in the polygon. In the graphics below, the yellow line is the original line, and the red line is the generated polygon. Here is an example of a polygon generated from a line with Buffer at 1 meter: 
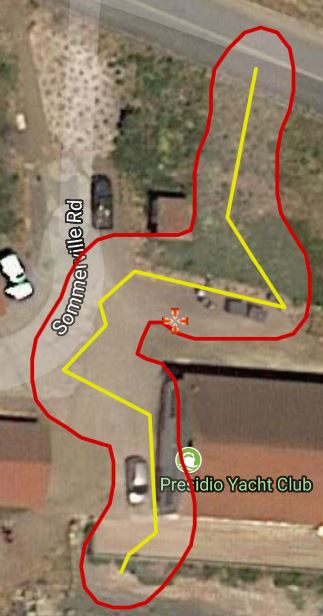
Note that the polygon generating software in POE will not introduce holes (islands), even if the line twists back on itself. If you have a situation that requires holes, use the Shape Editor to generate the polygon. |
| |||||||||||||||||
|
Section 3:
The dynamic form associated with the current project
The dynamic forms that appear in this section correspond to the dynamic forms available in the Observer Pro phone application.
For instance, suppose you make an observation with Observer Pro
with the Independent group and the
Advanced data collection project, which uses the
ADVANCED DATA COLLECTION form.
When you view that record with this application,
the same form will appear here in Section 3.
|
| |||||||||||||||||
At the top of this section, the name of the form is written in green.
Dynamic forms differ from one another as to which fields
they contain. However, all dynamic forms start with these four fields:
|
||||||||||||||||||
Other fields which may be present in a dynamic form include:
|
* indicates that a field is required. | |||||||||||||||||
 appears.
If a point is defined for this record,
a blue point
appears.
If a point is defined for this record,
a blue point 
| Section 4: Photos and PlantNet Identification | ||||||||||||||||
| Photos |
Any photos of this particular patch.
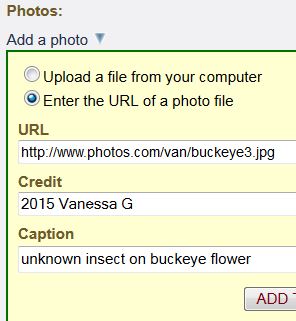
During editing, you can attach a photo to a record by uploading
it from your computer. Or, if your photo is already on the web,
you can paste in the URL.
If you are making a new record, and you upload a geotagged photo before setting a point location, POE will grab the coordinates and the date from the photo. When you are editing an observation that has more than one photo, you can change the order of the photos by dragging and dropping. |
Photos uploaded to Calflora are shrunk to 1200 x 900, and stored without exif (coordinate) information. |
||||||||||||||
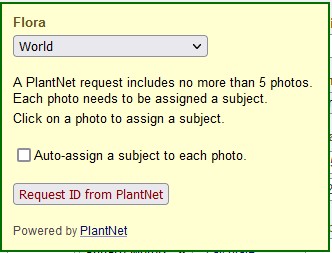
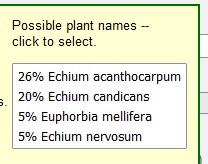
| PlantNet Identification |
If your observation record has one or more photos, you can run those photos through the
PlantNet
identification system, which may be able to identify the plant.
Note that this will only work after your photos have been saved to Calflora.
The PlantNet system needs each photo to be assigned a subject: leaf, flower, fruit, bark, or other. When you are editing the record, click on the photo to bring up a dialog with information about the photo, and choose a Subject.
Click on
ID from PlantNet If you have not yet assigned subjects to each of the photos, check Auto-assign a subject to each photo.
Click |
|
||||||||||||||
|
Here is some advice from the PlantNet
FAQ
about photos -- understand "type of view" as subject:
Sending several images of the same individual plant (up to 5) does improve the results, even if they are of the same type of view (flower, fruit, leaf, etc.). Some types of view, however, are more informative than others in the following order (best first): flower, fruit, leaf, entire plant, bark. It is often more efficient to submit several images of the most informative parts (e.g. several flowers and/or fruits) than trying to be exhaustive in the coverage of the different types. The bark view in particular is challenging. It is useful when there is no other visible part of the plant (e.g. deciduous trees during winter) but it leads to significantly lower accuracy than other views. Leaves are also often much less discriminative than flowers and fruits. Nevertheless, Pl@ntNet's AI algorithm automatically assigns different weights to the different types of view in accordance with those properties. You can thus submit images of different types without worrying too much about it. |
||||||||||||||||
| Section 4: Other Fields not included in dynamic forms | ||||||||||||||||
| Management Status |
Typically the earliest record of a patch has no value for management status.
(No value for management status is also referred to as reported, meaning
that the plant has been been reported once at the location, but not yet verified.)
A subsequent assessment of that same patch will be
automatically assigned a management status of verified.
Suppose you are looking for a particular plant patch at a precise location that was recorded in a previous year. If you do not find it, you could enter a record for that plant at that location and specify the management status as searched for but not found. If the patch is being treated, specify the management status as managed. If you check later and find that the treatment was successful, you can enter a new assessment and specify the management status as extirpated. |
|||||||||||||||
| Natural Status | Was the observed plant growing wild, or was it planted by a human? | Note that only records with Natural Status = wild are included by default in search results from applications such as Observation Search. | ||||||||||||||
| Region | For some Weed Manager groups collecting data with the Observer Pro phone app, the value of region will be automatically assigned to the name of one of a set of pre-defined regions. If you are using POE as an Independent, you can ignore this field, or use it to describe the general area where you observed the plant. | |||||||||||||||
| Ownership | (AKA National Ownership) A broad classification of who owns the land where the plant is growing. | |||||||||||||||
| Plant Identification | The primary method by which the observed plant was identified. (If you are entering a record and are not sure of your identification, choose uncertain.) | |||||||||||||||
| Elevation | The elevation at the point location of this patch. During editing, once a point location has been chosen, press lookup elevation to find the elevation. | |||||||||||||||
| Location Accuracy | An estimate of the accuracy of the location coordinates, expressed as an area in square meters. For instance, if the location accuracy is set to 100 square meters, then the idea is that the real point is somewhere within that 100 square meter area. | |||||||||||||||
| Gross Area |
The size of the area where the patch was observered.
If you have drawn a polygon, press calculate area to calculate the area of the polygon. If you have specified a Radius as a buffer around the point, press calculate area to calculate the area of the implied circle. |
More critically,
Gross Area
is the area of ground covered by the patch of plants,
if you drew an imaginary line around the outer boundary of the patch.
If Percent Cover is also recorded, then Infested Area can be calculated as
|
||||||||||||||
| Herbarium | If a specimen of the plant was taken and sent to an herbarium, the name of the herbarium. | |||||||||||||||
| Source Organization | If an organization was involved in the data collection effort that resulted in this record, the name of the organization goes here. | |||||||||||||||
| Documentation |
| |||||||||||||||
| Fields Populated when a Record Comes in from Observer Pro | ||||
|
| ||||
| Access | Set to unpublished. | |||
| Index Date | Set to the moment when the record is added to the database. | |||
| Observer | Set to the name of the person who is logged into Observer Pro, if it does not already have a value. |
Typically, the value of Observer will be the name of whoever is using Observer Pro. On some dynamic forms, this field is exposed, and the user can enter a different value. |
||
| Observation Type | Set to undirectedsearch if it does not already have a value. | |||
| Documentation Type | Set to reported. | |||
| Natural Status | Set to wild if it does not already have a value. | |||
| County | Set to the name of the appropriate county if the point location of the record falls within the boundary of a California county. | |||
| Group | This will be the Group chosen by the user when entering the record in Observer Pro. | If the user has selected a default group for new observations in My Calflora / Preferences, then, when the user enters an observation as Independent in Observer Pro, Group will be set to the selected default group. | ||
| Management Status |
If Number of Plants is 0,
Management Status is set to searched for but not found.
Otherwise, if there is a value for Treatment Method, Management Status is set to managed. Otherwise, if the record is a new assessment of an existing record, Management Status is set to verified. |
|||
| Region | Some Weed Manager groups have a set of regions defined (polygons of management areas). If the record belongs to one of these groups, and the point location of the record falls within one of the defined regions, Region is set to the name of the region. | |||
| Location Accuracy (square meters) |
If the record coming in from Observer Pro has a value for
|
Inside Observer Pro, | ||
| Location Quality |
Set to an appropriate value
(LOW, MEDIUM, HIGH)
depending on the value of | |||
| Gross Area | If Radius (in meters; a buffer around the point) is present in the dynamic form and has a value, then Gross Area is set to the area of the implied circle. | |||
| Forms in Observer Pro and Plant Observation Entry | ||
|
Data collection forms have been designed for use in both the Observer Pro (OP) phone applications
and POE. The appearance and behavior of most forms (for instance,
ADVANCED DATA COLLECTION) is similar on the phone and in POE.
Weed Manager groups have requested their own special purpose data collection forms, which may include fields that concern treatment, and/or the number of hours spent doing the treatment. Here are some things to watch out for in these more complex forms.
Region
Hours
Radius and Gross Area
Generate a polygon |
A regular polygon (octagon) generated from a point with a 3 meter radius, The area is 25.4 square meters. |
|
| The Population Record | ||
|
A history stack may have a population record associated with it.
When a history stack has polygons. a population record is automatically created.
You can also create a popuation for any history stack, even if it does not have polygons.
To see the population record, open the
POPULATION
You can also choose values for Priority, See also Weed Manager Design / Population Record. | ||
| More Information | ||
|
See also the Contributing Plant Observations FAQ For more information about map background layers, see Layer Help. For a description of all fields, see this Data Dicitonary. Plant Observation Entry is part of the Weed Manager system. For more information on the design of the system, please see
|
Example: Cindy Roessler's record of |
|
| Release Notes | ||
|
• September, 2023: v. 5.69: Added PlantNet identification from photos. • May, 2021: v. 5.66: Plant Observation Entry works on mobile devices! • November, 2020: v. 5.59: The Documentation field is now exposed and under user control. • August, 2019: v. 5.24: There is a new value of Access by others: obscured. Please see Obscuring a Location for details. • July, 2019: v. 5.18: When you are editing an observation that has more than one photo, you can change the order of the photos by dragging and dropping.
• May, 2019: v. 5.07:
The HOURS
• December, 2018: v. 4.89:
"Organization" changed to "Group".
• June, 2018: v. 4.61: If you upload a geotagged photo, POE will grab the coordinates and the date from the photo. • January, 2018: v. 4.40: If you are using a form that has a Buffer or Radius field, you can generate a polygon from either a point or a line.
• August, 2017: v. 4.22:
Introducing the population record, including a reference polygon, described
HERE.
When a history stack has polygons, a population record is automatically
created for it.
• October, 2016: v. 4.01:
The link to Work Session Entry in TOOLS has been replaced.
To edit the hours associated with a record, click on
HOURS
• April, 2016: v. 3.91:
When POE is showing a treatment record, the record number at the top
of the page is written in DARK RED.
This should make it clear that you are looking at a treatment record
without having to scroll down to see the treatment fields.
Inside of History,
the record numbers of any treatment records are also
written in • February, 2015: v. 3.44: If you are editing a record with photos, and the photos are stored on Calflora, you can rotate a photo clockwise or counter-clockwise by 90 degrees. Click on the photo to open the edit panel, and then click on the arrow for which way you want to rotate.
• December, 2014: v. 3.27:
When you are looking at a Weed Manager record, there is a link in TOOLS called
Work Session Entry
which goes directly to the work session entry app,
already dialed into the group, project, and date of the record.
If work session records have already been entered for this project
on this date, you will see them; otherwise you can enter them.
• September, 2014: v. 3.13:
Coordinates can be typed in directly, in decimal lat/long format.
(Open
• August, 2014: v. 3.12:
Nearby polygons are displayed.
(Open
• July, 2014: v. 3.01 (beta) released. | ||
If you have any questions about using this application, please
Example: Ron Vanderhoff's record of
Lycium californicum, California boxthorn,
Orange Co.