See also Survey Workflows
for a discussion of how some groups have used surveys.
About the Application
With the Survey Entry
application you can view, enter or edit a survey record.
A survey is a search for
certain plants in a discrete area at a certain time.
To enter a survey record, you will need to specify
the area, the date, and a plant list.
For each plant in the plant list, you can indicate whether or
not you found it, and if you did find it, how abundant it was.
Area
Every survey record has a point location.
If the area is a trail, for instance, the point location
might be the trail head.
A survey record also has a polygon describing the area searched.
The shape might be a pre-determined area -- for instance, the boundary of a park.
Alternatively, the shape could be a dynamic area, such as
a skinny little polygon generated from a tracklog.
The application has the ability to read in KML tracklogs, and
to generate polygons at some buffer distance around the line described by
the tracklog.
Plant List
The plant list indicates the plants you looked for.
Each plant on the list has a Count attribute.
Here are some possible values of Count:
0
You looked for the plant but did not find it.
1+
There is at least one plant in the area.
1
There is exactly one plant in the area.
50 - 100
There are between 50 to 100 plants in the area.
(empty)
You are still looking for the plant.
Adding a New Record
1. Press
NEW RECORD.
2. Choose an Group.
(If you are not a member of any groups, choose Independent.)
If the group you chose is a Weed Manager group,
you can optionally choose a Project.
3. Set a point location for the record.
Press Point Location
to open the popup.
Move the map to the general location, and zoom in.
Click .
Your next click on the map will become the point location of this record,
indicated by .
4. Add a polygon to the record.
There are four ways to add a polygon.
Use a saved polygon, either one that you have previously drawn and
saved by name, or one that you have previously uploaded from a GIS file.
Upload a KML tracklog, and convert it into a polygon.
(Or if you have a polygon in KML, upload it directly.)
Turn on the Protected Area map layer, put your point inside of a
protected area (for instance, a county park), and choose the boundary of that
protected area as your polygon.
Draw a polygon on the map.
To draw a polygon, press
Shape
to open the popup.
Then press
start drawing,
and click on the map to set the vertices.
Press stop drawing when you are finished.
5.
Enter a Name for this survey.
The values of Observer
and Date
will already be filled in. If necessary, change these values:
set Date to the date of your last visit to the area.
6. If you have already defined a
plant list
containing the plants that should be in this survey,
choose it by name from the Reference Plant List drop down.
7. Go to the PLANT LIST tab.
Add the plants that you looked for as part of this survey.
You can add them one by one, or by pasting in a list of plants,
or by pulling in the plants from the selected
Reference Plant List.
8. Go to the RECORD DETAIL tab, and enter values
for any relevant fields. All of these fields are optional.
(See below for more information.)
9. Press
SAVE.
Required values are indicated by *.
If any required field values are missing, the application will let you know.
Overview
The right side of the page is devoted to a map.
The left hand side is scrollable, and organized into several sections.
Basic Fields
Group
The organization responsible for this record.
If you are a member of any Calflora groups,
they will appear here in a drop down during editing.
The default group is Independent.
Access by others
published
The public (any Calflora user) can see this record.
unpublished
Only the owner
(or members of the group, if this record belongs to an
group) can see the record.
private
Same access as unpublished. Set the value to private
if you intend to keep the record out of the public eye for an extended period
of time.
Shape
indicates that a polygon is defined for this record.
Point Location
indicates that a point location is defined for this record.
* Name
The name of this survey.
* Observer
The person(s) who did the survey. When adding a new record,
this field is filled in with your name.
* Date
Date when the survey was complete, in the form YYYY-MM-DD. For example, 2016-12-31.
Reference Plant List
If you have already defined any
plant lists,
you can choose one here.
The RECORD DETAIL Tab
Gross Area
If you have added a polygon, press
calculate area to calculate the area of the polygon.
Otherwise, enter the estimated size of the area.
Natural Status
Are the plants recorded in this survey growing wild, or were they planted by a human?
Photos
Any photos of the survey area.
During editing, you can attach a photo to a record by uploading
it from your computer. Or, if your photo is already on the web,
you can paste in the URL.
Ownership
(AKA National Ownership)
A broad classification of who owns the land where the plant is growing.
Elevation
The elevation at the point location of this survey.
During editing, once a point location has been chosen, press
lookup elevation to find the elevation.
Access to the Site
unknown
public access
restricted access
special arrangements are necessary to visit the site
no access
Method
survey
checklist from a single visit
checklist from multiple visits
releve
rapid assessment protocol
plotlist
remote sensing
secondary source
Region
Some Weed Manager groups have a set of polygons describing the
regions (or management units) where they work.
For these groups, the value of region will be automatically assigned to the name of a region
based on the point locaiton.
If you are entering a survey as an Independent, you can ignore this field, or use it to describe the general area.
Plant List Source Web Page
If the plants in this survey or checklist came from another web page,
enter the URL of that page here.
The PLANT LIST Tab
This is the list of plants covered by this survey.
Each plant has a Count value (aka Number of Plants), indicating relative abundance in the survey area.
0 is a special value of Count, which indicates that the plant
was not found.
1+ is another special value of Count which indicates one or more plants were found.
Note that if the survey record is published and if a plant has any value for Count besides 0,
then the survey record will appear in Calflora public searches for that plant.
If you are still looking for a plant, leave the value of Count empty (aka "unknown")
and the survey record will not appear in Calflora public searches.
Some survey protocols for small areas (releve) require Percent Cover for each plant.
Check Percent Cover
to include the percent cover field for each plant in your survey.
The table of plants in this tab also has a Records column,
which indicates how many observation records of that plant are part of the survey.
Note that there are many surveys and checklists which have no observation records;
for these, the Records column is empty.
Adding Plants
Open Add One Plant
to add plants to the survey one-by-one.
Note that using this method, you can enter any name, even if it is not (yet) in the Calflora database.
Both the Taxon (scientific name) and Common (common name) fields are typeahead enabled.
Enter a plant name, choose a value for Number of Plants, and
press .
Open Add a List of Plants
to paste in a list of scientific plant names from another document.
Note that using this method, only scientific plant names already in the database are accepted.
If One plant name on each line
is checked, then the software expects each scientific plant name to be on a line by itself.
If you are copying and pasting from a speadsheet that has the complete scientific name in a column,
this is the best way to go. Any misspelled plant names will be reported back to you.
If One plant name on each line
is not checked, then the software will search the text for plant names.
If you are copying and pasting from a webpage, PDF, or Word document, this is the best way to go.
If you need to copy from a PDF document, it works much better to do it from Adobe Acrobat Reader
rather than from a browser.
Choose a value for Number of Plants that will apply to each plant you are adding.
Once you have pasted text into the box, press .
Note that once you have added a plant record, you can edit the record to change the
value of Number of Plants, but you cannot change the value of Taxon.
If you need to change the name of the plant, delete the existing plant record, and then add a new plant record
with the correct plant name.
Update
This application has features that make some specialized work flows possible.
Open UPDATE
to see some of these features.
If you have added observations to the survey of plants that are not yet
in the plant list,
check Add plants from observations.
and press .
If you have chosen a reference plant list, and want to add each plant in
the reference plant list to this survey's plant list,
check Add plants from the reference plant list.
Choose a value for Number of Plants that will apply to each plant you are adding,
and press .
Press to clear the plant list.
Press to update Number of Plants
(aka Count) for each plant in the plant list, based on the Number of Plants
field in each observation record that is part of the survey.
Here is what happens when you press the button.
For each plant in the plant list, the software adds up all of the
count values for observations of that plant which are part of the survey.
If there are no observation records for a plant, then nothing is changed.
If an observation has an empty count value, or the value 0, it is ignored.
If an observation has simple count value such as 7, then 7 is added to the sum.
If an observation has count value of 1+, then 1 is added to the sum.
If an observation has a range count value such as 11 - 50, then
the midpoint of the range (in this case 30) is added to the sum.
Finally the sum becomes the new value of Number of Plants
for that plant in the plant list.
For example, suppose that Adiantum aleuticum is a plant in the plant list.
There are three observation records of Adiantum aleuticum that are part
of the survey, with Count values of 1+, 3, and
11 - 50. The sum of these values (the new value of Number of Plants
for Adiantum aleuticum in the plant list) will be 34.
The OBSERVATIONS Tab
Particular observations can be associated with a
survey record if they are owned by you or one your groups.
An observation can be associated with at most one survey.
Use this tab to find your observations in the survey area,
and to add them to the survey.
Open
OBSERVATIONS IN THIS SURVEY
to see observations currently associated with this survey.
To remove an observation from the survey, click on the ID,
and then click remove from survey in the menu that appears.
Open
SEARCH FOR OBSERVATIONS
to add observations to this survey.
If this survey has a reference plant list, the search will be limited
to plants on that list.
You can also limit the search to observations made within a
range of dates.
You can also limit the search to observations which are
owned by one or more of the Calflora groups of which you
are a member.
To select groups, open
From Groups(s)
and check the groups (organizations) whose records you want to include.
Note that if you do not choose any groups, the search is limited to
your own records.
If a polygon is defined for this survey, check in polygon
to limit the search to observations found within that polygon.
To see all observations within the polygon, open
TOOLS
and click Group Observations (at this location)
or Observation Search (at this location).
Once you are seeing some search results, you can select which
observations to add to the survey.
To add a single observation to the survey, click on the ID,
and then click add to survey in the menu that appears.
Note:
When you add an observation to a survey, the survey record number is put into the
Survey ID field of the observation record.
If that field already has significant information in it, it will be lost.
If you want to add all of the records in the search results,
press .
If you want to add all records except a few,
go through the results,
click on the ID of the records you want to exclude,
and then click remove in the menu.
The record will disappear from the results.
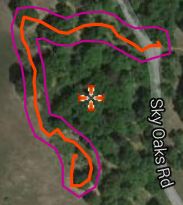
Check show lines and polygons
to display polygons (if any) associated with observations on the map.
Polygons and lines are displayed green
for observations already in the survey, and pink
for observations searched for but not yet added to the survey.
Specifying a Polygon
Every survey record requires a polygon. There are several ways to add a polygon to a survey record.
Drawing a Polygon
You can draw a polygon on the map.
When you are entering the record,
open Shape
and click .
Then click on the map to lay down the vertices.
Click when your polygon is complete.
For a step-by-step explanation of the process of drawing a polygon, see
Drawing a Polygon.
You can see all of your polygons in the
Shape Editor application.
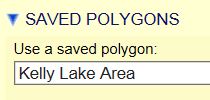
Using a Saved Polygon
Open Shape .
If you know the ID of the polygon you want to use, enter it in the
Shape ID box and press .
Otherwise,
open SAVED POLYGONS.
Your named polygons will appear in the drop down so that you can choose one by name.
You can also upload a KML track describing a line, and generate a polygon from it; see below.
Adding a KML Track
In the Shape section,
open UPLOAD KML TRACK,
and browse for a KML file on your computer that contains one or more lines.
Press .
When the KML has successfully uploaded, the
CHOOSE A LINE tab opens, showing all of the lines that were in the file.
Click on the ID of a line to choose it and display it on the map.
Open the EDIT THE LINE tab.
Press to edit the line before converting it to a polygon.
If there are many erroneous vertices, check
Select vertices by rectangle,
draw a gray rectangle over the vertices on the map, and press .
When the line is ready,
open the MAKE A POLYGON tab.
Choose a Buffer distance, and choose whether you want to allow the software
to introduce holes in the generated polygon.
(Note that polygons that have holes are not editable in this application.)
Then press .
If you need to, press to edit the polygon.
Note: If you have KML file that contains a polygon, you can upload it here and just use the polygon.
If you have a KML file that fails to load, please send it to us in an
email
and we will adjust the algorithms to make sure that kind of KML will load in the future.
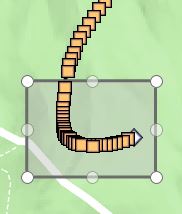
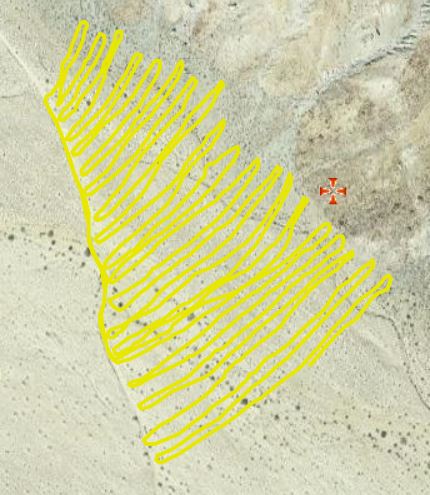
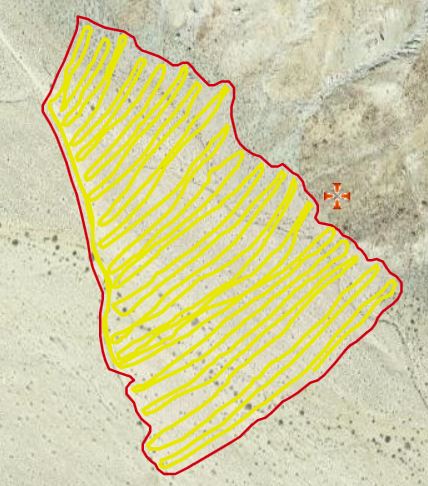
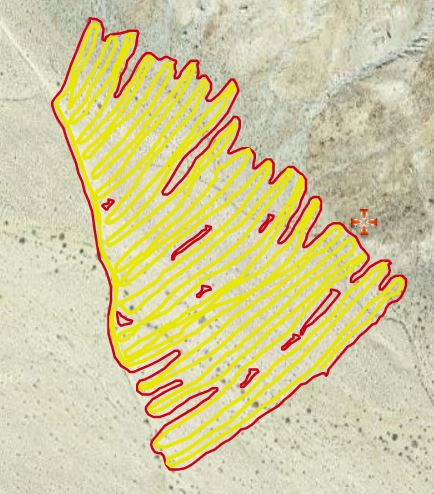
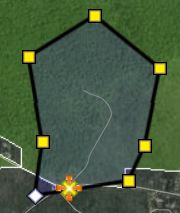
Polygons Generated from Lines
Here are some examples of polygons generated from lines.
1A. Original tracklog
1B. Generated polygon, buffer = 5
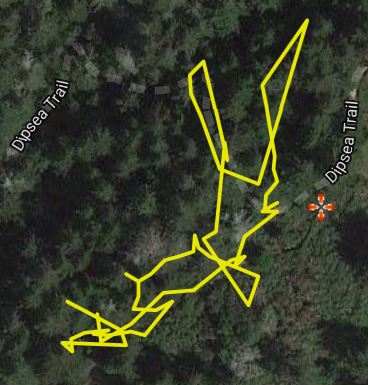
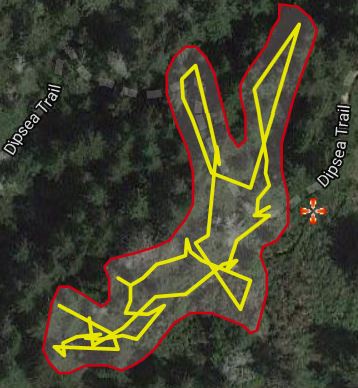
2A. Original tracklog
2B. Generated polygon, buffer = 10
2C. Generated polygon, buffer = 6
Note that the choice of a buffer distance (meters)
is related to how far the observers could see -- well enough
to identify plants -- on either side of the their path.
In series 1 above, the terrain is hilly oak woodland,
so 5 meters is appropriate.
In series 2 above, the terrain is flat desert, so
10 meters is probably more appropriate than 6 meters.
Note that in 2C above, where the buffer is at 6 meters,
the user checked Allow holes before generating the polygon, and the software introduced holes.
Finding your Survey Records
Once you have entered a survey record, you can find it in
My Observations.
It may be easier to find it if you
check only surveys / checklists.
If the survey is published, you can also find it with the
Checklist / Survey Search application.
This application is particularily useful for finding
surveys owned by a group.
Survey vs. Checklist
The concept of a survey is very similar to that of a checklist,
in that both are associated with an area and a plant list.
But where a survey happens over a very discrete time interval,
perhaps just one day, the time element of a checklist is much more
fluid. For instance, a checklist might represent all of the plants
an observer has seen in an area during multiple visits over the course
of several years.
(Since some plants are only identifiable at certain times of year,
a really comprehensive checklist necessarily involves multiple visits.)
With this application, you can distinguish between a survey and a checklist
by setting the value of the field called Method
(as in the method you used to assemble the information).
The date on a survey record indicates the date that the survey was complete.
For a checklist where there were multiple visits to an area,
it is the date of the last visit.
RELEASE NOTES
• May, 2020:
v. 1.30 released. If you are adding plant names from another document in the PLANT LIST tab,
it now accepts free text containing plant names. Using this method, each plant name does not
have to be on a line by itself.
• May, 2019:
v. 1.09 released.
• May, 2019:
v. 1.07 released.
This release includes the ability to see lines and polygons of the observations that are
part of this survey. It also includes the Region field in the RECORD DETAIL tab.
In the OBSERVATIONS tab, observations are sortable in either ascending or descending order.

 .
.
 indicates that a polygon is defined for this record.
 Open
Open
 Open
Open