| ||||||||||||||||||||||
|
Updated February 3, 2021
With the
Shape Editor application,
you can view and edit any of the lines and polygons you
may have added while you were entering observations.
You can also enter a new line or polygon.
You can also upload a polygon shapefile or KML file,
so that the polygons in the file become available for search
in Observation Search and What Grows Here?.
As a Calflora contributor, you have your own portfolio of lines and polygons. Each time you enter an observation record with a line or polygon, the line or polygon goes into this portfolio. Each time you make a search polygon from Observation Search or What Grows Here?, and save it by name, it goes into this portfolio. If you are a member of a group, then any lines or polygons associated with the group will also be available to you through this application. You can also share your polygons with a group. Please contact Calflora support with any questions about using this application. |
||||||||||||||||||||||
| Attributes | ||||||||||||||||||||||
A line or polygon stored by this application has only the following
attributes:
If you upload a shapefile of lines or polygons with this application you will be able to choose a single attribute from the shapefile to become the name of the line or polygon as it resides on Calflora. Other attributes will be ignored. If you have a shapefile with plant observation data in it, and you want to load the observations into your Calflora account, this is not the right application to use. If will be much easier to upload a shapefile of observations into your Calflora account if you use the Observation Upload application instead. |
|
|||||||||||||||||||||
| Search | ||||||||||||||||||||||
Open
 Search, Search,Search Criteria
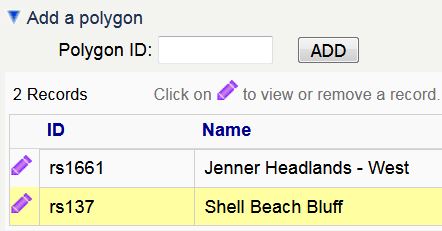
The rightmost column in the table is labeled "?" and indicates whether you can edit the record. If a checkmark ✓ appears in this column, then you can edit the record. | ||||||||||||||||||||||
| Editing a Shape Record | ||||||||||||||||||||||
To select a record, click on the
purple crayon  in the leftmost column. The line or polygon appears on the map, and
a panel opens up showing the details of the record.
in the leftmost column. The line or polygon appears on the map, and
a panel opens up showing the details of the record.
Open In the detail panel, press to edit the record. | ||||||||||||||||||||||
| Editing the Line or Polygon | ||||||||||||||||||||||
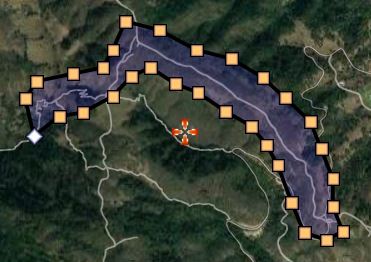
Press to change the line or polygon.
When editing, the vertices appear on the map as follows:
The first vertex appears as a white diamond,
 . . . .If you are editing a polygon, the inside of the polygon is shaded purple. You can change the map zoom level, or re-position the map by dragging, while you are editing.
Drag a vertex to move it. Click directly on a vertex to delete it.
To add a new vertex, click on the map. The new vertex will be inserted
in between the closest two existing vertices. If the new vertex does
not go where you expect, delete it, and try clicking very close to an existing vertex,
and then dragging the new vertex to where it belongs.
|
|
|||||||||||||||||||||
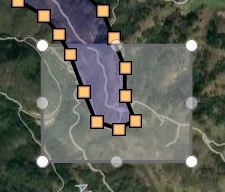
To delete many vertices at once, check
Press to delete all vertices within the rectangle.
|
|
|||||||||||||||||||||
| Edit Actions | ||||||||||||||||||||||
Open Edit Actions
| ||||||||||||||||||||||
| WKT | ||||||||||||||||||||||
|
If you are comfortable editing
WKT (well know text), you can change the low level
definition of a shape.
When you open WKT | ||||||||||||||||||||||
| Examples of Generated Polygons | ||||||||||||||||||||||
|
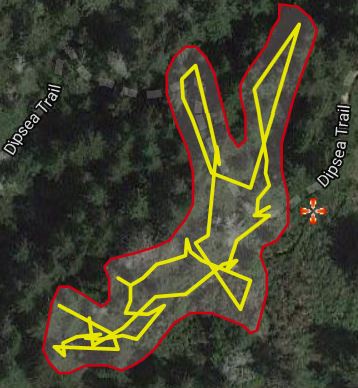
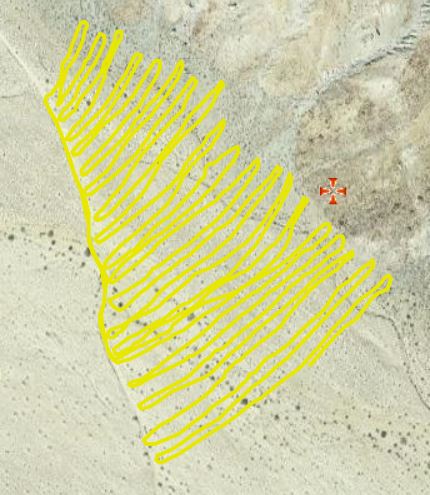
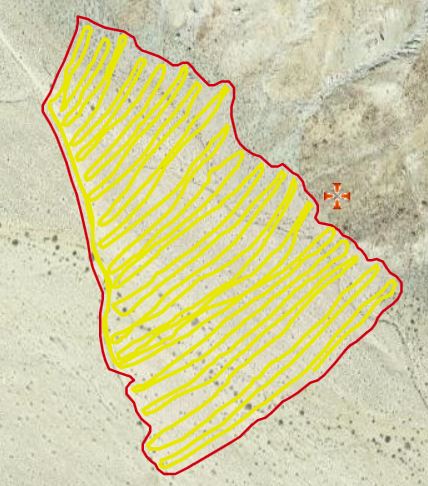
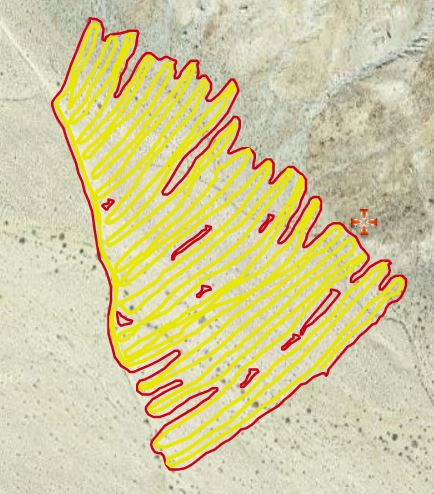
Here are some examples of polygons generated from lines.
Note the holes in 2C. below, when the value of Buffer is 6.
| ||||||||||||||||||||||
| Adding a Shape Record | ||||||||||||||||||||||
|
To add a new record, press
Add another.
Polygon or Line
Click on the map to add vertices.
The first vertex appears as a white diamond,
Drawing a Polygon. As soon as you have clicked to define three vertices, the map shows a polygon with the inside shaded purple. Each new click on the map adds a vertex in between the first vertex and the last vertex. Drawing a Line. Each new click on the map adds a vertex to the end of the line. Drag a vertex to move it. Click directly on a vertex to delete it. Press when you are done. Press to move vertices, add new vertices, or delete vertices. Press to save the new record.
(For a step-by-step explanation of the drawing process, see
| ||||||||||||||||||||||
Array of Polygons
Begin by checking Array of polygons.
In the panel that opens, open
When you press , a multi polygon is created, and the geometry of each component polygon in the table is added to it. The multi polygon is stored in the database, and can be used in the same way as a simple polygon -- for instance, to limit the area of a search. When you edit the array later, you can remove component polygons or add new component polygons. It is not possible to change the geometry of the array's multi polygon directly. However, if you do change the geometry one of the component polygons, and you want the change to be reflected in the array's multi polygon, all you need to do is to edit the array and save it again -- it will pick up the changed geometry of the component. The component polygons themselves are not affected by being included in an array. |
| |||||||||||||||||||||
| Upload | ||||||||||||||||||||||
|
Note that if you have a shapefile containing plant observations,
this is not the right application; if will be much easier if you use
Observation Upload instead.
Please
contact Calflora support with any questions.
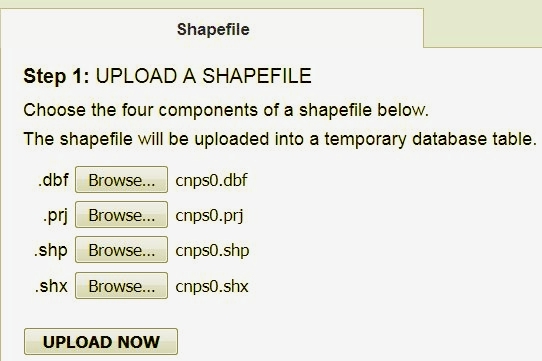
To upload a shapefile from your local computer, open Upload.
In Step 1, browse to find the four component files
of a shapefile. (Note that the .prj file is
necessary, and that .prj files are sometimes hidden on Windows systems.)
|
| |||||||||||||||||||||
| When the upload is successful you will see this message: |
| |||||||||||||||||||||
|
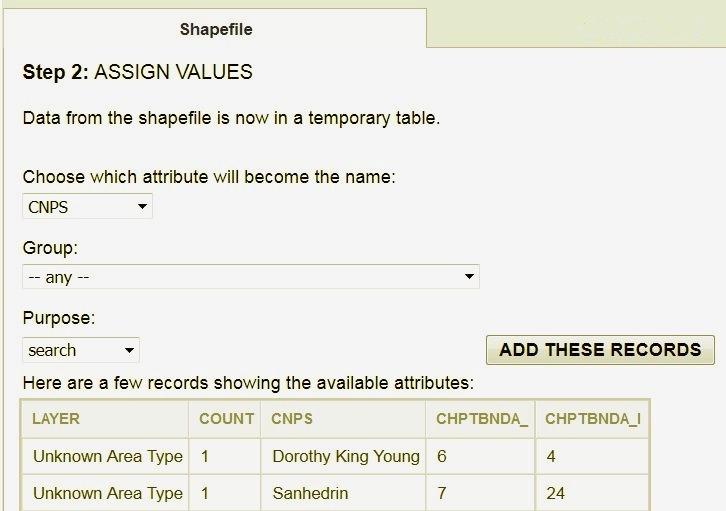
In Step 2, you assign values to the new polygon records.
You will see a few lines from the shapefile showing the available
attributes. Choose which attribute should become the
name of the polygon in your Calflora portfolio.
You can also choose to associate all of these polygons
with one of your groups. You can also assign a purpose for each polygon.
In the example on the right, the available attributes from the shapefile are
LAYER,
COUNT,
CNPS,
CHPTBNDA_, and
CHPTBNDA_J.
In this case, the user chose the attribute CNPS to become the name of the polygon
-- by looking at the records in the table, you can see that this attribute has values like
Dorothy King Young and Sanhedrin.
In this case, the user chose "search" as the value of Purpose, so that these polygons will be available for searching from applications such as Observation Search. If you are planning to use the uploaded polygons in observation records, then set Purpose to "assessment", and they will be available from the Plant Observation Entry application. Once you have assigned values, press . |
| |||||||||||||||||||||
|
When the records have been added, you will see this message:
To find the records you just added, use the search function of this application. |
| |||||||||||||||||||||
| Download | ||||||||||||||||||||||
| After you have searched for some shape records, you can download them to your computer, and then use them in desktop GIS. At the moment the only supported format is GeoJSON. If you need the shapes in a shapefile, download them as GeoJSON and then use QGIS to convert them to a shapefile. | ||||||||||||||||||||||
| The Purpose Attribute | ||||||||||||||||||||||
Each shape record can have one of five possible purposes:
SAVED SHAPES,If you are planning to use a polygon you see here as the polygon of an survey record, give it a name and and set Purpose to "assessment". Then it will be available in the Survey application. | ||||||||||||||||||||||
| Regions | ||||||||||||||||||||||
|
This is especially pertinent to Weed Manager groups:
if your group is responsible for certain management units,
you can add the boundary polygons of those units to Calflora.
The boundary polygon of a management unit is referred to as a region.
If you have a desktop GIS file containing the boundary polygons of your management units, upload it into Calflora with this application. Make sure that each polygon is owned by your group, and that the purpose is set to REGION. Once region polygons are defined for your group, then when new observations come in associated with that group, the coordinates of the observation will be matched against region boundaries, and if possible, the Region field of the observation record will be assigned accordingly. Also, if the folks in the field need to be able to easily determine whether they are inside or outside of a management unit, your group's region polygons can be loaded into the phone app. Each group member can use the Background Lines and Polygons application to choose which polygons they want to see on their phone. See also Weed Manager / Regions. | ||||||||||||||||||||||
| Batch Edit | ||||||||||||||||||||||
|
The Batch Editor
is a feature of this application
which can make changes to many of your records at the same time.
It is a powerful and potentially dangerous tool.
Using the editor is a two step process. First, you use the criteria on the left hand side of the page to search for matching records. Then you open the editor, and specify a change to one or more fields. The editor will work only if you are able to edit all of the matching records.
To open the editor, enter some search criteria,
press , and then open
In the editor panel, you can specify changes to the records that match your search. Once you have entered the changes you want to make, press . This action will ask you to confirm, and then apply the changes to all of the records that match your search, even if you cannot see them in the result table.
For instance, to associate all matching records with one of
your groups,
select the group from the Group
drop down (bottom left).
Press
to make the changes happen.
You can also delete all matching records. First, search for the records you want to delete, and then press . This action will ask you to confirm, and then delete all of the matching records. Note that changes made by the Editor are not recoverable. | ||||||||||||||||||||||
| Shapes on Observer Pro | ||||||||||||||||||||||
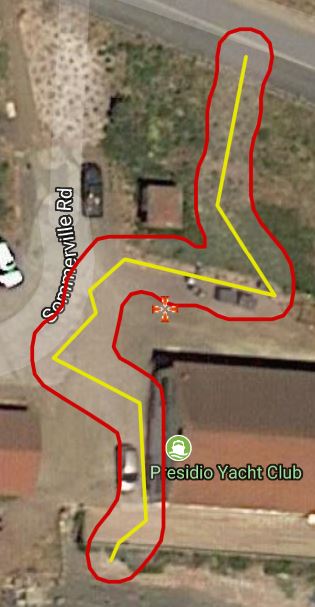
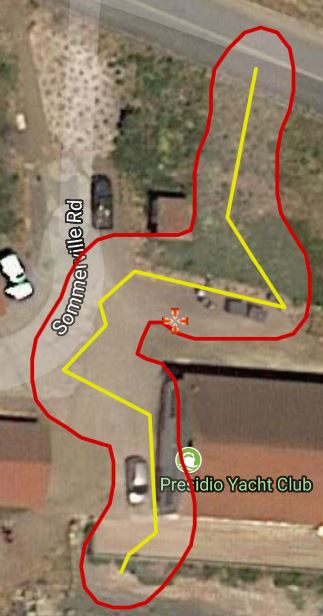
|
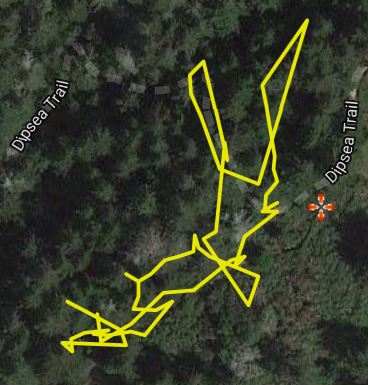
Any named lines or polygons you make with this application
can be loaded into the Observer Pro phone application.
So, for instance, if you have a line representing a trail,
you could load it into Observer Pro so that
it sppears bright yellow. Then when you are in the field with your phone,
you will know when you are close to that trail.
Use the Background Lines and Polygons application to choose which polygons you want to see on your phone. | ||||||||||||||||||||||
| RELEASE NOTES | ||||||||||||||||||||||
|
• September, 2020:
In v. 1.40 there is a new Batch Editor function
under
TOOLS.
• January, 2020: In v. 1.26 there is a new type, Array of polygons which is stored as a multi polygon in the database. It is also possible to split a multi polygon into separate simple polygon records. • December, 2019: In v. 1.23 the entry date of each shape appears in the table of results. You can also search by entry date. • March, 2019: In v. 1.09, when you are editing a shape, there is a new Select vertices by rectangle function. You can use this function to delete many vertices at once. • January, 2018: In v. 1.00, the generate a polygon function has been improved, and is now available with buffer values from 1 meter to 20 meters. Note that it can take a long time to run, more so with a large original line and/or a small buffer value. • September, 2017: As of v. 0.98, you can search by geometry type (eg. line polygon etc). • June, 2017: As of v. 0.95, this application can display multipolygons and polygons with holes. However, it is still possible to edit only simple polygons and lines. • July, 2016: As of v. 0.86, the editor panel opens under the selected record, instead of at the top of the page. Also, the vertice count of the selected shape is displayed. • December, 2015: As of v. 0.70, the shapefile uploader takes up more room on the page, so that it is easier to see the attributes. • August, 2014: As of v. 0.60, this application has the ability to upload a shapefile. The polygons in the shapefile can become part of your personal portfolio of shapes, or part of your group's portfolio of shapes. REGION is a new possible value for purpose. • August, 2014: v. 0.59 (beta) released. | ||||||||||||||||||||||

 .
.