Move to the part of the state you are interested in,
zoom in a few times, and press
.
A list of plants found in the area shown on the map will appear,
divided up by lifeform. To see all of the annual herbs, press
Annual Herb
To see exactly where a particular
plant was observed, press the record count
for that plant, choose an icon
and press display points.
Open Criteria
to constrain which plants are returned, and to control the output.
Open
PLANT FILTER
to select, for instance, only natives, or only plants on a particular list.
Open
RESULTS
to change the sort order or to
select a different presentation format.
Open
POINTS
to put points on the map for all of the matching plants.
Open
AREA
to specify the search area more precisely.
Press DRAW A POLYGON
to specify an exact geographical search space.
To find all plants in a particular park,
Click on LAYERS (above the map on the right)
to see the menu of background layers.
Inside the LAYERS menu, click on Region
to see all of the region background layers.
Click on
Protected Area (CPAD)
to select the background layer that has park boundaries.
Then click
.
inside one of the parks or forests that appear on the map.
The name of the selected area will appear below the map:
Andrew Molera State Park (CDPR)
In the AREA section,
check
in selected background
Then press .
SOURCES OF DATA
This application utilizes all sources of data available to Calflora including
observation records contributed directly to Calflora by Calflora users;
checklists and surveys contributed directly to Calflora by various institutions and individuals;
iNaturalist records contributed to Calflora by iNaturalist users, or assimilated automatically from the iNaturalist API; and
specimen records assimilated from the Consortium of California Herbaria (CCH).
PLANT FILTER
Scientific Name
Typeahead enabled. Enter a full scientific name or just the genus.
Family
Full family name, case insensitive. For instance ERICACEAE.
Plant List
Choose an existing general purpose list, or
define your own special purpose list.
Status native, non-native, rare (according to CNPS),
invasive (according to Cal-IPC)
One plant on each line. Click on the scientific name to
see a detail panel with photos and a link to
the Calflora Taxon Report for this plant.
photo
An expanded, illustrated plant list format,
with plant attributes, three photos and the bloom time icon.
Click on the scientific name to see
the Calflora Taxon Report for this plant.
text
The results in tab delimited format, suitable for
copying into a spreadsheet. (To get this data into Excell,
copy it from the What Grows Here? page, and then use 'Paste / Special' in Excell.)
Order by How the results are sorted --
Scientific Name
or Record count.
If you sort by Record count,
plants with the most occurrences are listed first.
Group by Lifeform
When this is checked, the results are separated into
eight lists, one for each lifeform,
so that you can choose which lifeforms you want to see.
Press the button
in front of the name of a lifeform to
see all of the plants.
Grasslike
Annual Herb
Perennial Herb
Shrub
Tree
Vine
Fern
Other
Location Quality of records considered in the search, relative
to the complete set of records in Calflora.
any
includes checklists for
huge areas.
MEDIUM
includes checklists for small areas.
HIGH
includes only precise points.
Minimum records / plant The number of records of each plant that must be found for the
plant to be included in search results.
Asking for a count of greater than one
is a technique for eliminating singleton or unconfirmed observations.
PLANT NAMES
Scientific Name Enter a genus name to limit the results to plants in a certain genus.
Family Enter a family name to limit the results to plants in a certain family.
Plant List Choose one of your lists to limit the results to plants on that list.
PERIOD
Start Date Limit results to plants observed after this date.
The default start date is January 1, 1920.
End Date Limit results to plants observed before this date.
AREA
in map area If checked, the search is limited to the area shown on the map.
in selected background This control appears when
there is a background layer selected, such as
Watershed or
Protected Area (CPAD).
If checked, the search is limited to the selected background polygon.
DRAW A POLYGON Press this to open a panel where you can enter or edit
a polygon on the map.
Press ,
then click on the map to enter three or more vertices.
in polygon This control appears if there is a polygon defined,
either because you just drew a polygon,
restored a previously saved polygon,
or if a polygon came into
the application from URL parameters.
If checked, the search is limited to the area of the polygon.
SAVED SEARCH POLYGONS (This option is only available if you are signed in to Calflora.)
Press this to open a panel where you can save the polygon
you just drew by name, or restore a polygon you saved in a previous
session.
To save a new polygon, enter a name, and
press .
To see and edit all of the polygons you have saved,
use the Shape Editor application.
POINTS
ICON PALETTE
To view the locations of a plant in the result list
on the map, you have a choice of various colored icons.
The default icon is a blue point:
A palette is a set of plant - icon assignments.
As you choose icons to display various plants, you are
implicitly making a
custom palette.
Custom palettes can be saved and used again.
You can also choose one of three predefined palletes:
NATIVE
A convenience palette for displaying observations differentiated by nativity.
Press display next to native,
and the application will read points for all native plants in
the result list, and show them on the map using a blue point icon.
Press display next to non-native,
and the application will show points of non-native plants
using a red point icon.
STATUS
A convenience palette for displaying observations differentiated by status:
rare, native, non-native or invasive.
LIFEFORM
A convenience palette for displaying observations differentiated by lifeform.
custom
For any plant shown in the results,
press the record count,
select a colored icon to use for that plant
and press display points.
The application will read points for that plant in the selected
area and show them on the map using the selected icon.
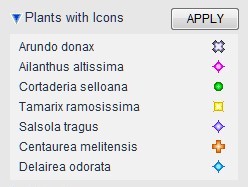
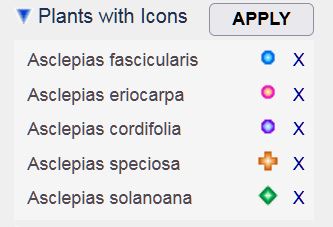
The application keeps a list of all of the
plant - icon assignments you make in this way.
To see this list, press Plants with Icons:
:
By going through the process of assigning icons
to plants, you are defining a custom palette,
and can use it again.
If you move to a different area on the map and
press ,
the points for all plants with icons will be read
for the new area and displayed on the map.
Use the Palette Again:
To save the current palette (your list of plant - icon assignments), press
My Palettes.
Enter a name into the
Save the current palette as:
text box, and press .
During a subsequent session with this application,
you can select it from the
Use a previously saved palette
drop down. Then press ,
and points for all the plants in the palette will be read
and displayed on the map.
When you save a palette in this way, you own it and are
the only one who can change it. However, other people can
use it if you give it to them in a URL as described above.
See the EXAMPLES below.
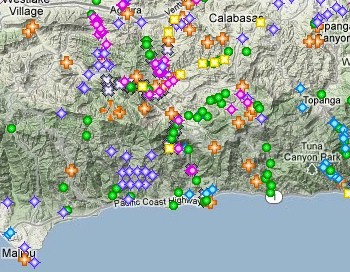
Click on an icon
to see details of that observation:
Proximity of various invasive plants
in the Santa Monica Mountains
indicated by colored icons:
INDICATIONS of LOCATION QUALITY
For records with a high location quality,
the point on the the map indicates a specific location -- if the plant is still
alive, you may be able to find it by going to that location.
For other records, the point indicates just the general area in which the plant was found, and not a specific location.
If a record has a medium or low location quality,
it is displayed on the map with a white halo around it.
In the graphic, the blue point on left has a high location quality,
and the point on the right has a medium location quality.
If a record is obscured, then the point appears at the center of the quarter quad in which the plant was found. The quarter quad itself is displayed as a blue rectangle.
LOCATION
Find a Location in California:
Enter the name of a place in California you are interested in.
You will see a list of all matching place names statewide, along with the county for each one.
When you choose one of the matching place names, the map will jump there
and open an InfoWindow over the exact location.
TOOLS
LOCATION PROFILE
Check this box to see elevation, climate and soil factors
of the current map cursor location
.
Illustrated Plant List (printable)
This application itself does not print very nicely
-- the header and the map are fixed, which means that they repeat
on each printed page.
Once you have some interesting results showing,
press this link to go to a printable Illustrated Plant List of the plants in your results.
Advanced Search (species attributes)
Once you have some interesting results showing,
press this link to go to the
Advanced Search application, where you can view and download
any of 45 attributes of the plants in your results.
Observation Search at this location
.
Once you have search results, press this link
to run an equivalent search in the Observation Search application.
Where What Grows Here? can show a summary of plants in an area,
Observation Search can show all observation records in the same area.
This works for a selected background area (eg. a park),
or for a user defined search polygon.
Planting Guide at this location
.
Once you have search results, press this link
to see commercially available native plants compatible
with the elevation, climate and soil factors of the
current map cursor location
Place Names at this location
.
Search for place names (mountains, creeks, historical towns, etc) near the current map cursor location.
When you choose a background layer such as Watersheds,
the application will show the
name of the watershed where the map cursor
is located, under the map.
Click on the various watersheds to see their names.
If the Precipitation background layer is showing,
click on the map to see average annual precipitation
at that point
.
Super Planning Watershed:
Tassajara Hot Springs 3309.6003
Click on Streams to see rivers and creeks on the map.
If you are zoomed way out, you will only see the longest rivers.
As you zoom in, the shorter streams appear.
When you check Stream names, a stream icon
will appear at the end of each creek or river.
When you click on the icon, you see the name of the creek or river, and the name
of the stream that the creek or river flows into.
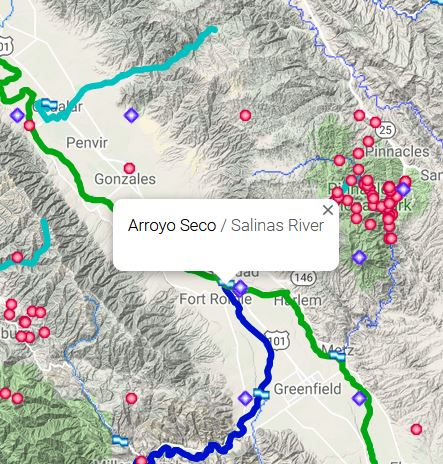
For instance, in Monterey County,
the icon for the creek called Arroyo Seco
appears at the end of the Arroyo Seco, where it flows into the Salinas River.
When you click on the icon an info window pops up describing the junction:
Arroyo Seco / Salinas River
The course of the stream itself -- the Arroyo Seco -- is highlighted in blue. The course of the
downstream creek or river -- the Salinas River -- is highlighted in green.
Uncheck Stream names to clear the map of all stream icons
and all stream course highlighting.
If you move to a different location on the map or change zoom level, and would like to see
stream name icons at the new location, press the refresh button
.
What Grows Here? on Mobile
When you use What Grows Here? on a mobile device with a narrow screen,
all of the controls at the top of the page collapse to the left.
The map appears on top of the other controls.
Use the map to choose your location and zoom level,
and then touch
MAP
to get it out of the way so that you can see the plants.
Because of the screen width, only one photo per plant is shown.
If you want to see the plants in one long list (instead of grouped by lifeform),
open RESULTS
and uncheck Group by Lifeform.
Viewing your search in the field:
Once you have done a search, and set up the screen just the way you want it
(eg. with the map not showing, and the plants appearing in one long list),
press again so that your choices wil be included in the URL.
Now you need to arrange for your search to be easily findable later when you are in the field.
Using Chrome on an Android device, there are three ways to save your search.
Touch the Chrome options menu icon in the upper right.
Touch the star to bookmark the current URL.
Or, touch Share... and then Gmail to email the URL to yourself.
Or, touch Add to Home screen and then give your search a name, such as
Plants in Van Damme SP. A new icon will appear on your home screen.
When you touch the icon, you will go right back to your search in Chrome.
Chrome will cache the plant photos.
At some point when you have good connectivity,
scroll through all the photos to give the browser a chance to cache them
-- then they will be available when you go back to this search later.
Example Searches
Commercially available, low water tolerant
native grasses
in the Paso Robles area.
A plant is included in the results only
if there are at least two records of the plant in the search area.
(To find commercially available low water native grasses
appropriate for your area, start with this search, and move the location.)
All plants in Andrew Molera State Park, Monterey County.
A plant is included in the results only
if there are at least two records of the plant in the search area.
Native plants in the McKay Cove Waterfall Watershed (immediately south of Big Sur, including Julia Pfeiffer Burns State Park and Slate Hot Springs).
This search looks for records with MEDIUM or better location quality,
and includes plants in the results if there are at least three records in the search area.
The format is set to
photo,
so that the results appear as an illustrated plant list.
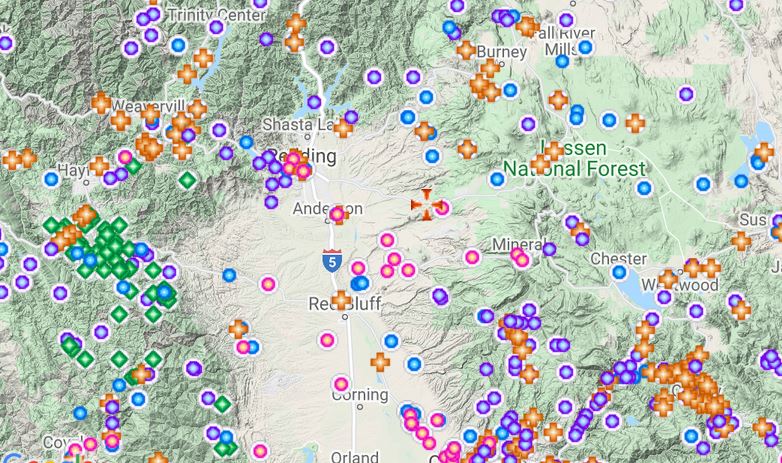
Arctostaphylos species
in an arbitrary area of the northern Sierra foothills east of Chico.
The search area is a user defined polygon.
Common Oaks of Calfornia, starting in
an arbitrary area of the northern Sierra foothills east of Chico.
This example illustrates the use of a
custom palette
(Common Oaks)
as a search technique.
If you start with this view, then
move to a different location and press
, the application will load points
in the new location for the twelve species of oak
included in this
custom palette.
1.
Click on LAYERS (above the map on the right)
to see the menu of background layers.
2.
Inside the LAYERS menu, click on Region
to see all of the region background layers.
Click on
County
to select the county background layer.
When
County
is selected,
county boundaries appear on the map, and
when you click on the map, the name of the county appears below the map. (Note that this only works inside of California.)
3.
Select your county by clicking on the map. The name of your county will appear below the map. For instance,
if you clicked on the town of Paso Robles, San Luis Obispo County will appear below the map.
4.
Open
AREA
and check
in selected background.
This will restrict the search to plants found within the selected county.
5.
Open
RESULTS
and set Minimum records / plant to 3 records.
This will eliminate any plants for which there are fewer than 3 observations in the county.
6.
Press .
The total number of plants found appears below, as well as the number of plants in each lifeform.
You can also add additional criteria to reduce the number of plants found. For instance, to find only native plants,
open PLANT FILTER
and set Status to native.
7.
To see the results as an Illustrated Plant List,
open TOOLS and click Illustrated Plant List (printable).
On the Illustrated Plant List page, you may choose to group the plants by family,
show the bloom period for each plant, or show three photos for each plant.
8.What Grows Here? searches can be shared. For instance, here is a list of native plants observed in
San Francisco County created by following the steps above:
(Hint: to get a similar flora for a different county, open the San Francisco search above, click on the map in a different county,
and press .)
FREQUENTLY ASKED QUESTIONS
Q:Is there a way that I can see all points
for the matching plants immediately, without having to
click through the plants one-by-one?
A:
Yes, here are two ways:
Open the POINTS panel. The default ICON PALETTE is
called "NATIVE".
Press display next to native
to see points for all native plants.
Press display next to non-native
to see points for all non-native plants.
Open TOOLS
and press the Observation Search link. This will
run almost the same search on Observation Search, and show a point
for each matching record.
Q:For one plant in the search results,
it says 14 records, but when I
ask to see points for that plant, I only see 9.
Why is the count different?
A:
This kind of discrepancy usually happens because quad level
data is included in the search for plants
(for instance, quad level records of rare plants from the CNPS Inventory),
but not included when you ask to see points for the plant.
Q:Why would I use this application instead of
Observation Search or Plant Distribution?
What kinds of search is each application best suited for?
A:Observation Search is good for seeing all observations
in a relatively small area. It will show the photos attached to each observation.
You can limit the results by date, contributor, etc.
Plant Distribution is good for seeing the statewide
distribution of a single plant.
It is also good for looking at a very close up view of a single
record -- it will show lines and
polygons if any are available.
What Grows Here? will show a list of
plants in a given area.
By the use of colored icons,
it is also good for juxtaposing the point distributions
of two or more plants.
RELEASE NOTES
v. 3.82 June, 2022
There is a new link in the TOOLS menu:
Advanced Search (species attributes).
Use this link to go to the
Advanced Search application, where you can view and download
any of 45 attributes of the plants in your results.
v. 3.78 July, 2021
When points are displayed on the map:
If the record has a medium or low location quality, it is displayed with a white halo around it.
The halo is easier to see when the map is in Satellite mode.
If a record is obscured, then the point appears at the center of the quarter quad
in which the plant was found.
The quarter quad itself is displayed as a blue rectangle.
This display style emphasizes that for certain records, the point
indicates a general area in which the plant was found, but not a specific location.
v. 3.74 March, 2021
On mobile devices, your current location is shown (and updated in real time) by a blue dot.
You can also click the “Pan to my location” button in the upper right corner of
the map to re-center the map to your current location.
If your search returns only a small number of results, the results are not
automatically grouped by lifeform.
v. 3.68 January, 2021
v. 3.67 December, 2020
v. 3.62 February, 2020
v. 3.46 May, 2019
The former What Grows Here wizard application is now included in What Grows Here itself.
Open LOCATION
and type in the name of the place you are looking for.
v. 3.17 October, 2017
v. 3.05 January, 2017
The application has be reconfigured to work on mobile devices.
v. 2.60 August, 2016
Plant lists are ordered by group.
"NATIVE" is now the default icon palette, which
makes it easier to see points for all matching plants
immediately.
v. 2.49 January, 2016
When you select Format = photo, WGH shows three photos
for each plant when three photos are available.
v. 2.46 October, 2015
In the PLANT FILTER section, when you select a plant list,
a view link appears.
Click on this link to see an illustrated version of
the plant list.
v. 2.39 August, 2015
Group by now divides the result list of plants
into sub-lists;
Group byLIFEFORM
makes a sub-list for each lifeform, and the user can shoose
which sublists to open.
v. 2.36 July, 2015
LOCATION PROFILE has moved to inside of the TOOLS menu.
The Scientific Name and Family search criteria have moved into
a new PLANT NAMES section.
Lifeform: Grasslike plants are now treated as a separate lifeform from herbs.
Select
Lifeform = "Grasslike" to find grasslike plants.
Select
Lifeform = "Herb" to find wildflowers other than grasses.
There are three new selection criteria in the PLANT FILTER section:
Commercially available (based on information from
CNPLX), shade tolerant, and
low water tolerant.
v. 2.15 December, 2014
Once you have search results in What Grows Here?,
press Tools / Observation Search
to run an equivalent search in the Observation Search application.
Where What Grows Here? can show a summary of plants
in an area, Observation Search can show all observation records in the
same area. This works for a selected background area (eg. a park),
or for a user defined search polygon.
v. 2.07 September, 2014
Open LOCATION PROFILE to see
elevation, climate, and soil information about the
current location.
Search polygons can be saved by name, and re-used
in another search explicitly.
Open AREA, then SAVED SEARCH POLYGONS.
Press Tools / Printable version of this page
to get a version of your current search results that prints nicely.
If you do not want to print the map, turn the map off
before pressing this link.
v. 2.0 March, 2013.
This version was funded by a Conservation Innovation Grant
from NRCS California, with matching funds provided by the Calflora Database.
 Annual Herb
 and press display points.
 Criteria
 PLANT FILTER
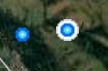
 will appear at the end of each creek or river.
When you click on the icon, you see the name of the creek or river, and the name
of the stream that the creek or river flows into.
will appear at the end of each creek or river.
When you click on the icon, you see the name of the creek or river, and the name
of the stream that the creek or river flows into.
 MAP
MAP
 Press
Press