| |||||
|
Updated September 12, 2021
With the
Group Reports application
you can run reports on the data collected by your group.
If you have any questions about this application, please contact
|
|||||
|
Search Criteria
|
|||||
|
Specific Reports 1. Observation Count by Region and Plant
This is the simplest report, but also the most useful for data quality control purposes.
This report shows how many records there are for each plant in each region.
The results look like this:
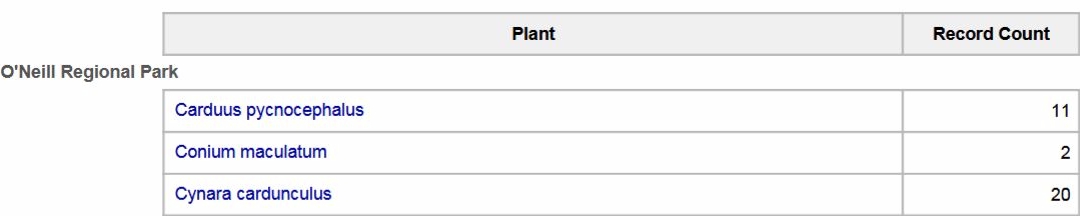
The name of the region
(O'Neill Regional Park)
is on the left side.
The name of each plant found in the region is a link.
Click on the plant name link to go to a Multiple Group Search
search with all of the criteria of the report (groups, projects, region, plant list, start and end date)
as well as the plant name.
Quality Control To fix a problem like that, you can click through to Multiple Group Search and use the Batch Edit facility, or use Plant Observation Entry to fix the records one by one. 2A. Patch Count by Group, Region and Plant
Patch is also known as population.
Inside of the Weed Manager system, the history of a patch is described by a history stack
(many observations of the same plant, at more or less the same location, over time).
Note that for reports that concern patch counts, the date criteria (month and year) are not available. This is so that the root record of each stack will be included, no matter how old it is. This report shows how many patches there are for each plant, categorized by group and region. The results look like this: 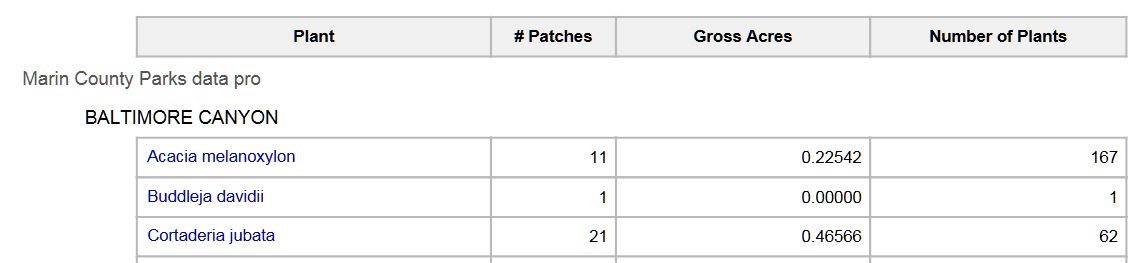
The name of the group
(Marin County Parks data pro)
is on the left side.
The name of the region
(BALTIMORE CANYON)
is on the left side.
The name of each plant found in the region is a link.
Click on the plant name link to go to a Multiple Group Search
search with all of the criteria of the report (groups, projects, region, plant list)
as well as the plant name.
The results appear in Multiple Group Search in stack order, where you can see all of the observations that make up each stack. The Gross Acres and Number of Plants columns show the sum of those values for the most recent record in each stack. 2B. Patch Count by Region and Plant
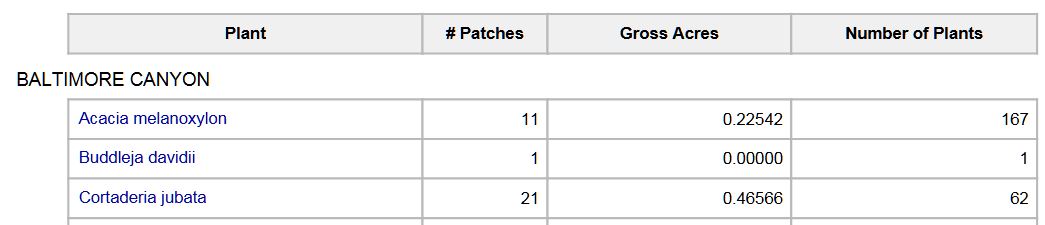
This report shows how many patches there are for each plant categorized by region, no matter which group they are from.
The results look like this:
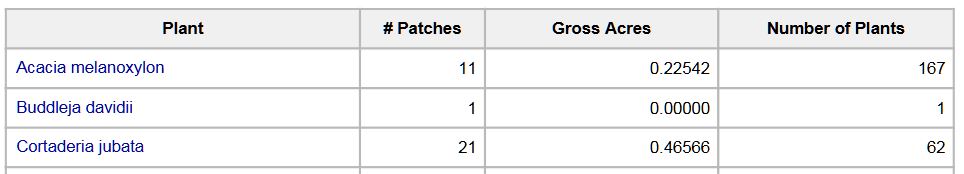
2C. Patch Count by Plant
This report shows how many patches there are for each plant, no matter which group they are from or in which region they are found.
The results look like this:
3. Patch Summary by Plant and Region
This report shows a summary of each patch meeting the criteria.
The results look like this:
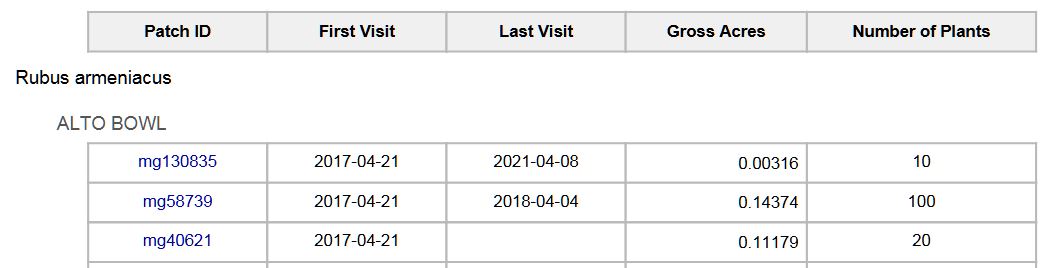
The name of the plant
(Rubus armeniacus)
is on the left side.
The name of the region
(ALTO BOWL)
is on the left side.
Patch ID is a link; click on it to see the observation records in Plant Observation Entry.
Note that in the example above, the third patch, mg40621, consists of a single observation record. In other words, this patch has only been visited once. For each patch, the values of Gross Acres and Number of Plants come from the most recent record. |
|||||
|
|
|||||
|
| |||||
|
RELEASE NOTES:
• September, 2021: v. 0.76 • July, 2019: v. 0.74 | |||||