Observations
Check
Individual observations
to display observations in the current map area.
This represents the actual known range of the plant.
If you zoom out or move the
map, press to re-display observations in the map area.
When you click on an observation point
,
an info window
appears showing a summary of the observation, with
a link to see full record details.
Potential habitat ...
by Watershed
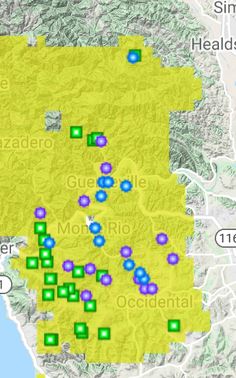
When the application first comes up, it highlights
the watersheds (CalWater super planning watersheds) where the plant has been seen.
If there are two or more observations in the watershed
it is highlighted in
yellow.
If there is a single observation in the watershed
it is highlighted in
orange.
by Climate Model
Check
Climate Model
to display areas where the plant might grow according to the
climate model algorithm.
These areas are highlighted in yellow.
POTENTIAL HABITAT CALCULATIONS
It is a challenge to come up with a way
to visualize both the known range and the potential habitat of a plant.
Ideally the visualization will provide useful information at various scales, from the whole state to very local.
Range is a geographic boundary; potential habitat is made of the biotic and abiotic elements within that range that combine to make some places hospitable to a species, even if not all the apparently suitable habitat is occupied. We generally don't know why it's not occupied. It could be that our understanding of suitable habitat is missing some critical element. It could be a failure of dispersal. It could be local extirpation. All we really know for sure is that habitat is suitable if the plant occurs and survives there.
(JK)
This application has two ways of showing potential habitat.
Both rely on the availability of adequate observation data.
by Watershed
The application uses
CalWater super planning watershed polygons.
The application shows where the plant is known to grow, extrapolated to the encompassing watershed.
There are 2300 super planning watersheds in California.
by Climate Model
The application shows potential habitat for the plant based on algorithmic prediction.
The algorithm utilizes two systems for analyzing the geographical space of California:
A grid of
30 arcsecond cells.
It takes 599,114 of these cells to cover the land mass of California, including the islands.
The algorithm works as follows. For each ecoregion that contains the plant, it collects the
values of
elevation, precipitation, summer high temperature, winter low temperature,
temperature range, accumulated temperature, wet season, growing season, and hardiness zone
for each occurrence of the plant in the ecoregion, to produce a set of ecoregion-specific tolerances.
(See CLIMATE LAYERS for more information.)
It then considers every 30 arcsecond cell in that ecoregion. When the values of a cell
are within ecoregion-specific tolerances, that cell is included in the potential habitat.
Discussion
Both methods involve an extrapolation of where the plant might be from where the plant is known to be.
In some situations the watershed method gives the best suggestion of potential habitat;
in other situations, the climate model method gives the best suggestion.
TOOLS
Open the TOOLS menu for these functions.
SHARE THIS PAGE
When you click on this link,
the current state of the page is
added to your browser's URL.
After pressing this link, you can
use the browser to bookmark the URL;
copy the URL and email it to someone; or
use the browser's back button later to return to this state.
LOCATION PROFILE
Check this box to see elevation, climate and soil factors
at the current map cursor location
.
What Grows Here?
Click this link to bring up the
What Grows Here
application at this location to see what other plants grow hearby.
Observation Search
Click this link to bring up the
Observation Search
application to see all nearby observations of the plant.
SHAPES and ICONS
Polygon data is available for some plants.
If data is available, a Polygons
checkbox appears. Check this box, and the
available shapes will be drawn on the map.
Shapes appear as shown on the right.
Note that most polygons are tiny,
so that you must zoom way in to see them.
Switch the map to Satellite to zoom very close.
Polygon observations are indicated
by a pink circle.
Point observations are indicated by a purple circle.
Obscured observations are indicated
by a blue square. Obscured observations are displayed
at the center of the containing quarter quadrangle.
A quarter quadrangle is 1/256 of a square degree.
The quarter quad itself is displayed as a blue rectangle.
Specimens are indicated
by a blue circle.
If surveys or checklists are available for this plant,
they are indicated by a green square.
If you do not want to see checklists, you can turn them off.
For certain plants (eg. rare plants in the CNPS Inventory), quad data is available.
A quad is a USGS quadrangle, or 1/64 of a square degree.
A quad record means that the plant has been found somewhere within that quad.
Quads are indicated by a yellow square.
If you do not want to see quads, you can turn them off.
Records of potential habitat are indicated by an orange circle.
Questionable records are indicated by a red X.
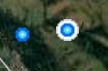
If a record has a medium or low location quality, it is displayed on the map with a white halo around it. In the graphic, the specimen point on left has a high location quality, and the point on the right has a medium location quality.
POLYGON EXAMPLES
Cytisus scoparius (scotch broom)
Corte Madera Marin County Open Space District
Cytisus scoparius (scotch broom)
west of Whiskeytown Lake National Park Service Exotic Plant Management Team
Ailanthus altissima (tree of heaven)
Jackson Amador County Agriculture Department
Carthamus lanatus (wooly distaff thistle)
east of Olema Marin County Open Space District
RELEASE NOTES
• December, 2021: v. 2.43
The climate model is now also available for non-native plants.
• January, 2021: v. 2.33
The climate model is a new way of showing potential habitat for a plant.
• December, 2020: v. 2.32
LOCATION PROFILE is now included in the TOOLS menu.
• November, 2020: v. 2.30
For non-native plants,
if there are several super planning watersheds in the same hydrologic area
that have observations of the plant, then all of the super planning watersheds
in that hydrologic area
are considered to be potential habitat and colored
orange.
• November, 2017: v. 2.02
Watersheds: the potential habitat is differentiated from the
confirmed range by highlight color.
 ,
an info window
appears showing a summary of the observation, with
a link to see full record details.
,
an info window
appears showing a summary of the observation, with
a link to see full record details.


 If a record has a medium or low location quality, it is displayed on the map with a white halo around it. In the graphic, the specimen point on left has a high location quality, and the point on the right has a medium location quality.